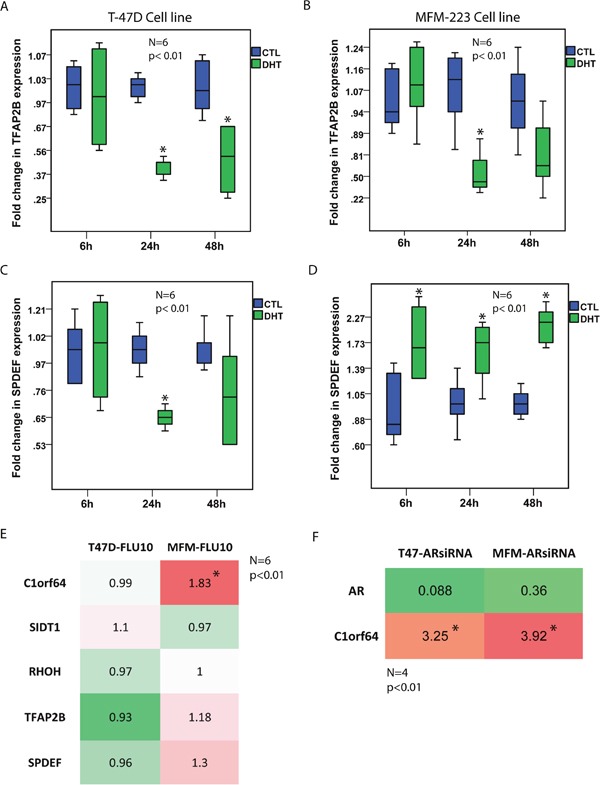
Figure 2. The effects of AR activation and inhibition on the expression of AR-signature genes.

(A and B) Fold changes in TFAP2B expression using qRT-PCR after DHT treatment at 10 nM in T-47D and MFM-223 cell lines at 6h, 24h, and 48h time-points. Fold changes are relative to the control (CTL) experiments at each time-point. *, p< 0.01 is for DHT-treated vs. control groups. (C and D) Fold changes in SPDEF expression using qRT-PCR after DHT treatment at 10 nM in T-47D and MFM-223 cell lines at 6h, 24h, and 48h time-points. *, p< 0.01 is for DHT-treated vs. control groups. (E) A Heat map to show fold changes in the expression of C1orf64, SIDT1, RHOH, TFAP2B, and SPDEF genes using qRT-PCR after flutamide (FLU) treatment at 10 μM for 24h in T-47D and MFM-223 cell lines. Expression values are relative to the controls. Experiments were carried out in 6 replicates and *, p< 0.01 is for FLU-treated vs. control group. Red color denotes up-regulation and green color indicates down-regulation. (F) A Heat map to show fold changes in AR and C1orf64 expression following AR-silencing with an AR-siRNA duplex in T-47D and MFM-223 cell lines. Fold changes are measured using qRT-PCR. Experiments were carried out in 4 replicates and *, p< 0.01 is for C1orf64 expression in AR-siRNA vs. control-siRNA.
