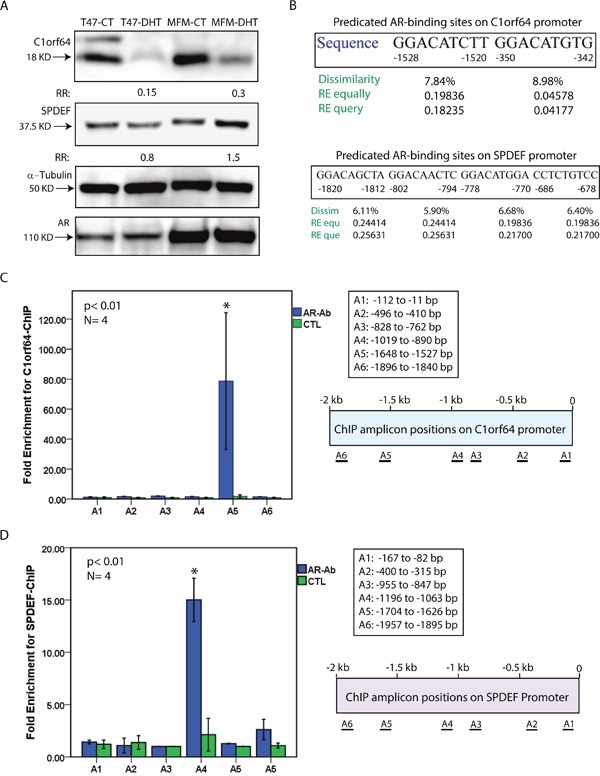
Figure 3. Western blot analysis and ChIP assays for C1orf64 and SPDEF.

(A) immunoblotting to assess C1orf64, SPDEF, and AR protein levels in T-47D and MFM-233 cell lines following DHT treatment at 10 nM for 24h. Fold change (RR) in each band density was measured relative to control in three replicate experiments. A mouse α-tubulin antibody was applied to assess loading. (B) Predicated AR-binding sites in the 2 Kb promoter region of C1orf64 and SPDEF genes using PROMO software. Binding sites were predicted within a dissimilarity margin ≤ 15%. Dissimilarity (Dissim) margins, and Random Expectation (RE) values using RE equally (equ) and RE query (que) models for the predicated sites are shown. (C) ChIP assays for C1orf64 promoter using AR antibody (AR-Ab) to assess AR binding to each promoter region (A1-A6). Amplification of 1% of input chromatin was used as the input control and a non-specific antibody (CTL) served as negative control. ChIP assays were carried out in four replicates and fold enrichment is shown for each amplicon. ChIP amplicon positions (A1-A6) on C1orf64 promoter are shown. *, p< 0.01 is for AR-Ab vs. CTL. Error Bars: ± 2SEM. (D) ChIP assays for SPDEF promoter using AR antibody to assess AR binding to each promoter region (A1-A6) as outlined in (C).
