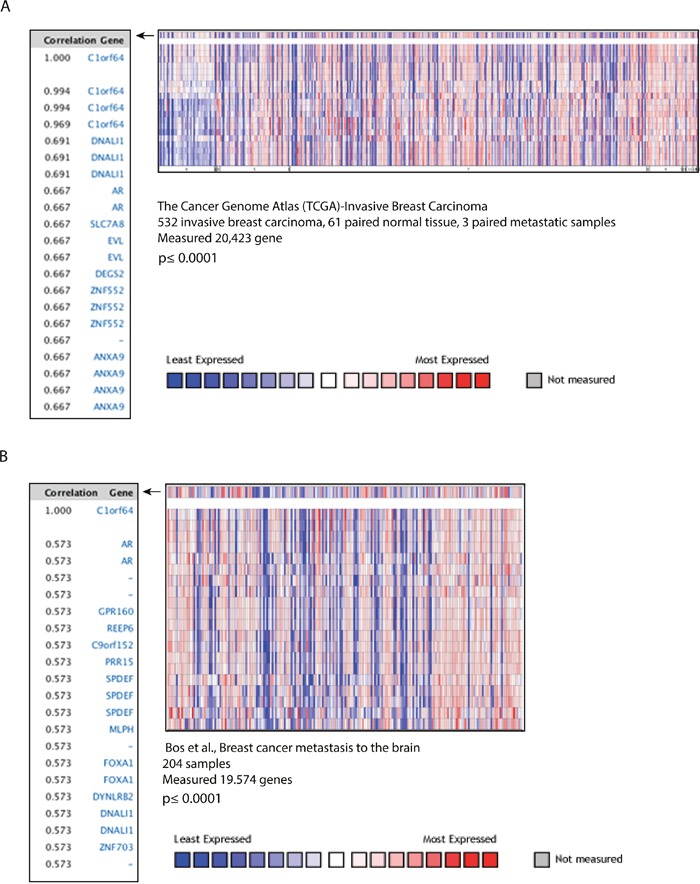
Figure 4. C1orf64 co-expressed genes in breast tumors.

(A) Heat map and correlation coefficients of C1orf64 co-expressed genes in TCGA-Invasive Breast Carcinoma Gene Expression Data analyzed using ONCOMINE. Correlation values are shown for the top co-expressed genes with C1orf64 (p≤ 0.0001). Heat map depicts the gene expression pattern across the tumor samples. (B) Heat map and correlation coefficients of C1orf64 co-expressed genes analyzed using ONCOMINE in a dataset published by Bos et al. Correlation values of the top co-expressed genes with C1orf64 (p≤ 0.0001) and a heat map for gene expression across the cohort are shown.
