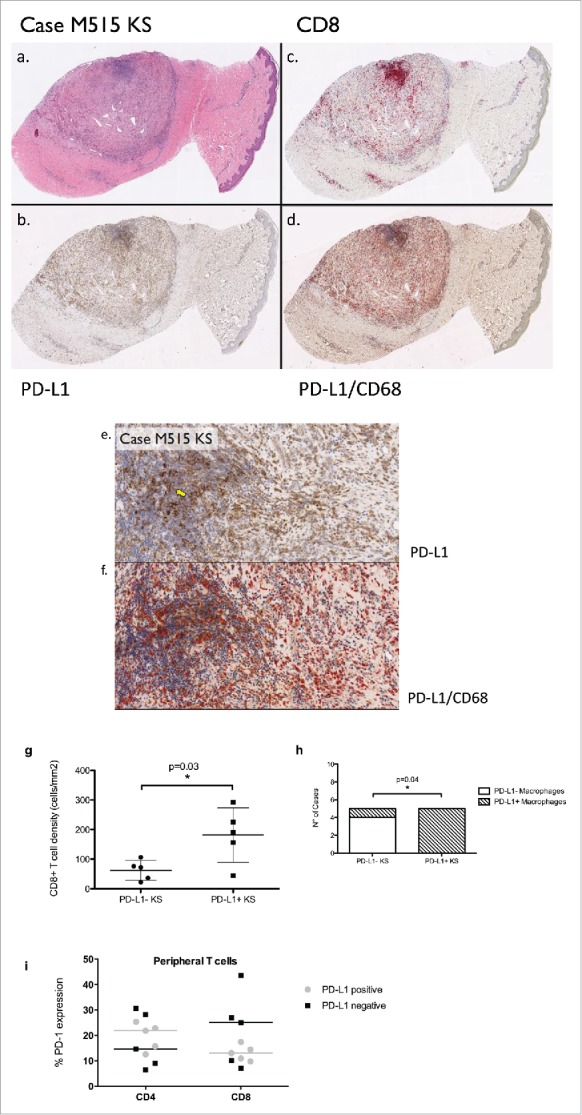
Figure 1.

A) Hemotoxylin and eosin, showing the presence of abundant Kaposi's sarcoma tumor spindle cells. (B) Programmed death ligand 1 (PD-L1) expression, showing tumor-cell expression of PD-L1 that was judged to be 1+ in our scoring system, representing weak cytoplasmic expression above baseline. (C) CD8+ staining shows the infiltration of cytotoxic T lymphocytes. (D) Dual staining with PD-L1 and CD68 shows the presence of numerous tumor-infiltrating PD-L1-expressing macrophages. (E, F) Representative sections of PD-L1 positive KS (E) and CD68/PD-L1 co-immunoexpression (F) at high magnification (200×). A yellow arrow identifies areas of immunopositive KS. (G) The positive relationship between PD-L1 positivity in KS cells and CD8+ peritumoral immune infiltrate. (H) The positive relationship between PD-L1 positivity in KS and in the surrounding PD-L1 expressing macrophage infiltrate. (I) The relationship between PD-L1 expression in KS and PD-1 expression in peripheral CD4+ and CD8+ T cells. Bars are representative of median values of PD-1 expression in PD-L1 positive (gray) and PD-L1 negative (black) KS samples.
