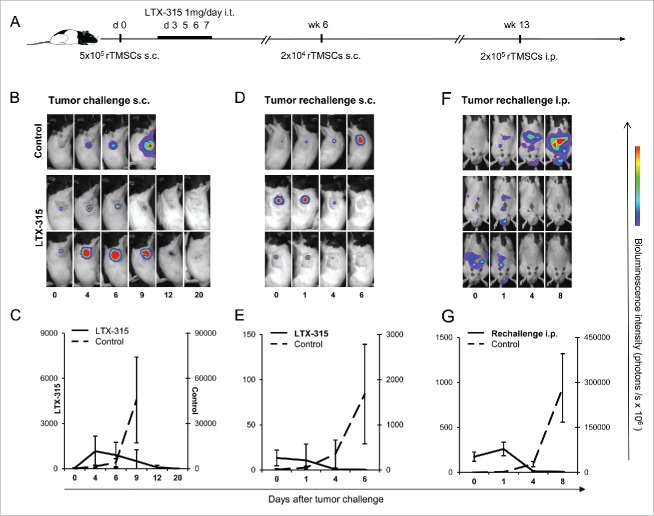
Figure 3.
Intratumoral administration of LTX-315 inhibits rTMSC growth (A). The time schedule of LTX-315 injections and tumor rechallenge experiments. Tumors were established by an s.c. inoculation of 5·105 rTMSCs in the right flank of syngeneic PVG rats. On days 3, 5, 6 and 7 after tumor inoculation, experimental rats (n = 6) were given an i.t. injection of 1 mg LTX-315. Age-matched control rats (n = 6) received injections of saline in parallel. Antitumor responses were assessed by bioluminescence imaging (BLI) of luciferase-expressing tumor cells, images were acquired at the indicated days post-tumor inoculation. (B) Representative whole-body images of rats during treatment with LTX-315 or saline vehicle control. Total luciferase activity is summed up and depicted in figure (C), showing tumor progression and response to LTX-315 treatment. The bold line refers to treated rats, while the dashed line represents the pattern for saline vehicle. A mean ± SD in the treatment group is compared with the controls. The 6 treated rats designated as tumor-free were rechallenged s.c. with 2·104 rTMSCs in the opposite flank in week 6, while other naïve rats were included as controls (n = 6). (D) Representative images of previously treated rats and controls after the second s.c. challenge with tumor cells and (E) graph charting the tumor growth. Values are expressed as a mean ± SD of hexaplicates in treated and control rats. The experimental animals survived the second challenge without signs of tumor growth, and were exposed to a third challenge of tumor cells in week 13 administered by an i.p. inoculation of 2·105 rTMSCs. A control group was included (n = 6). (F) Representative images of animals initially treated with LTX-315 after i.p. challenge, including control rats. (G) Graph charting intraperitoneal tumor progression in treated and control rats. The data are the mean ± SD of hexaplicates.

