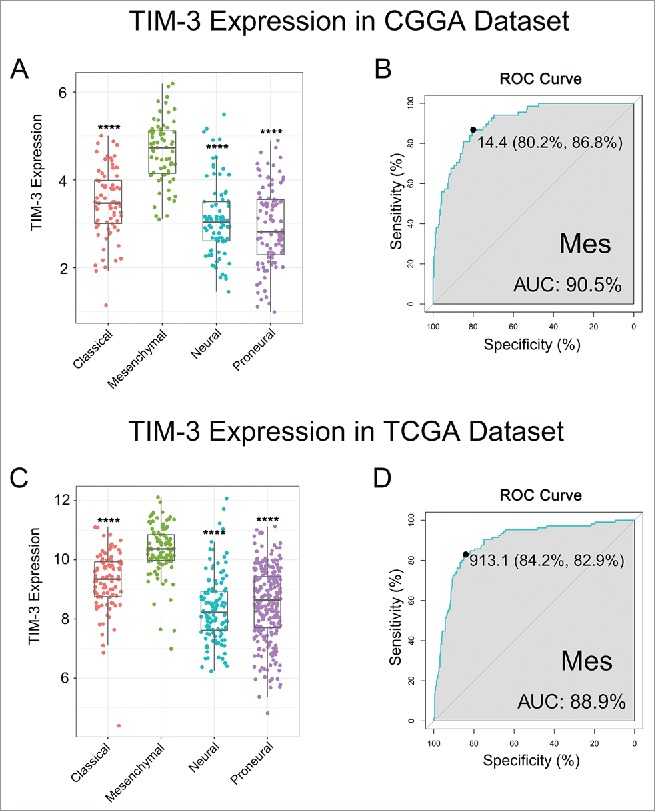
Figure 2.

TIM-3 was highly enriched in mesenchymal molecular subtype glioma. (A, C) TIM-3 expression pattern in different molecular subtypes in CGGA and TCGA data set. (B, D) ROC curve analysis showed that TIM-3 had highly sensitivity and specificity to predict mesenchymal subtype in CGGA and TCGA database. **** indicates p < 0.0001.
