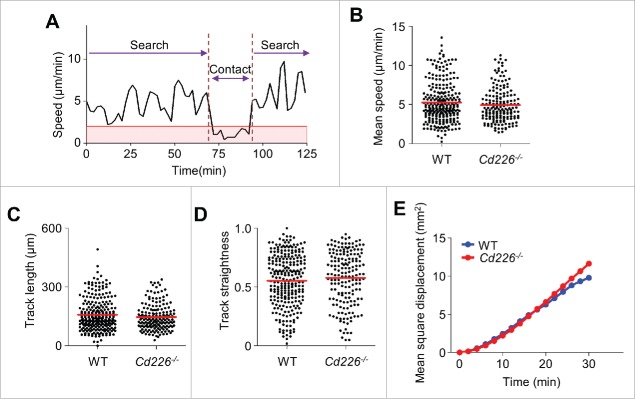
Figure 4.
Migration modes of NK cells around cancer cells. (A) Representative profile of NK cell migration speed (n = 10 movies of 3 independent experiments per group). (B – E) Mean speed (B), track length (C), track straightness (D), and mean square displacement (E) of WT (n = 255) and Cd226−/− NK cells (n = 174).

