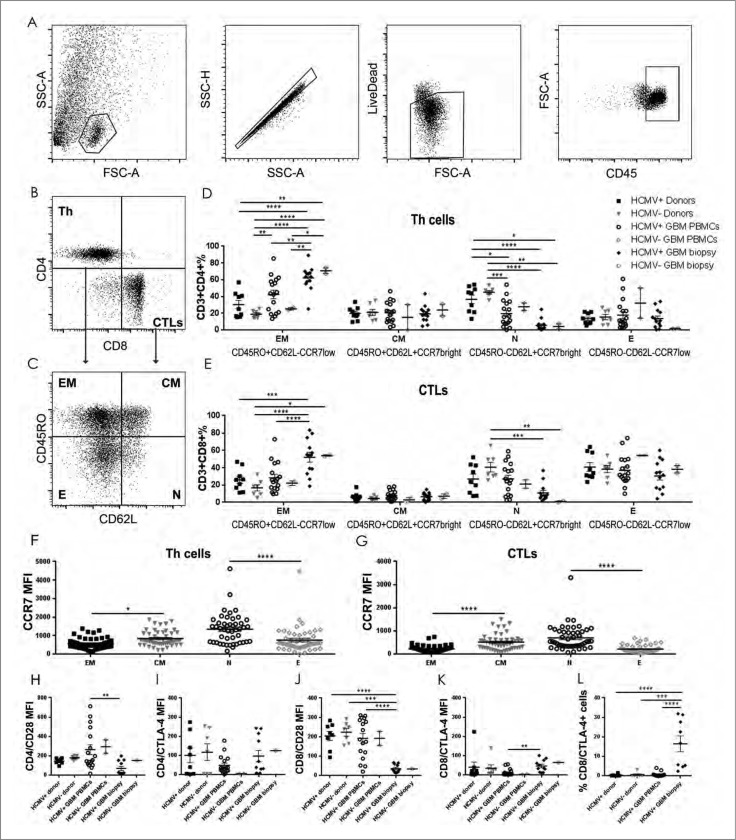
Figure 3.
Increased CD4+ and CD8+ TEM cells in HCMV+ GBM tumor with higher CTLA4/CD28 ratio compared with donor peripheral blood. (A) Representative dotplots showing lymphocytes in dissociated GBM tumor gated on FSC vs. SSC; singlets, live dead and within CD45+ cells, left to right. Representative dotplots showing (B) CD4+ (Th) vs. CD8+ (CTLs) T cell populations and (C) CD45RO vs. CD62L populations within the Th cell and CTL gates. % mean ± SEM of (D) Th (CD3+CD4+) and (E) CTLs (CD3+CD8+) naïve (N: CD45RO−CD62L+CCR7bright), central memory (CM: CD45RO+CD62L+CCR7bright), effector (E: CD45RO−CD62L−CCR7low) and effector memory (EM: CD45RO+CD62L−CCR7low) in peripheral blood (n = 22) and tumor (n = 19) of HCMV+ and HCMV− patients compared with seropositive vs. seroponegative donors (n = 16) (Two way ANOVA, Bonferroni's multiple comparison *P < 0.05, **P < 0.01, ***P < 0.001 and ****P < 0.0001). Mean MFI ± SEM of CCR7 within (F) the Th (CD3+CD4+)and (G) CTLs (CD3+CD8+) T cell subsets, showing low CCR7 expression in TEM and TE subsets (Two way ANOVA, Bonferroni's multiple comparison, *P < 0.05, and ****P < 0.0001). Mean MFI ± SEM of (H) CD28 and (I) CTLA-4 within the Th (CD3+CD4+)TEM; (J) CD28 and (K) CTLA-4 within the CTLs (CD3+CD8+)TEM (Two way ANOVA, Bonferroni's multiple comparison, **P<0.01, ***P < 0.001 and ****P < 0.0001). (L) % mean ± SEM of CTLA-4+ cells within the CTLs (CD3+CD8+)TEM (Two way ANOVA, Bonferroni's multiple comparison, ***P < 0.001 and ****P < 0.0001).

