Figure 5.
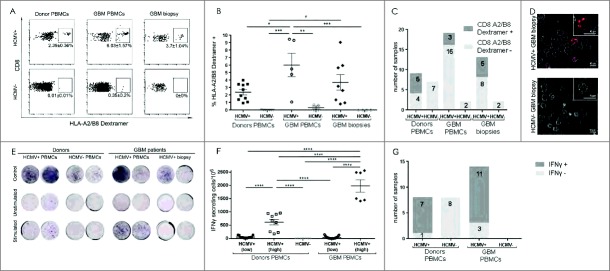
Increased HCMV-specific CD8+ T-lymphocytes with reduced function in HCMV+ GBM. (A) Representative dotplots showing HLA-A2/B8 dextramer restricted pp65- and IE-1 specific CD8+ T cell populations. (B) % mean ± SEM of HLA-A2/B8 dextramer+ CD8+ T-cells and (C) bar graph showing frequency of samples containing HLA-A2/B8 dextramer HCMV-specific CD8+ T cells in HCMV+ and HCMV− patients' blood (n = 21), tumor (n = 15) and healthy donors' blood (n = 16). (D) Live cell confocal microscopy images visualizing HLA-A2/B8 dextramer+ HCMV-specific CD8+ T cells in GBM dissociated tissue from HCMV+ vs. HCMV− patients, Magnification 630X, scale bar 10 μm. (E) Representative IFNγ ELISpots from seropositive vs. seronegative patients' blood, tumor and healthy donors with and without stimulation with pp65 or IE-1 HCMV peptides. IFNγ secretion was considered positive when number of cells secreting was ≥ 0 total cells. (F) % mean ± SEM of IFNγ secreting cells/106 total cells after stimulation with pp65 or IE-1 HCMV peptides in HCMV+ patients (n = 14) vs. HCMV+ and HCMV− donors (n = 16). Low IFNγ secretion ≥ 8; High IFNγ secretion ≥ 150 per 106 total cells. (G) Frequency of GBM patients and donors samples containing IFNγ secreting cells after stimulation with pp65 or IE-1 HCMV peptides in HCMV+ patients (n = 14) vs. HCMV+ and HCMV− donors (n = 16).

