Figure 3.

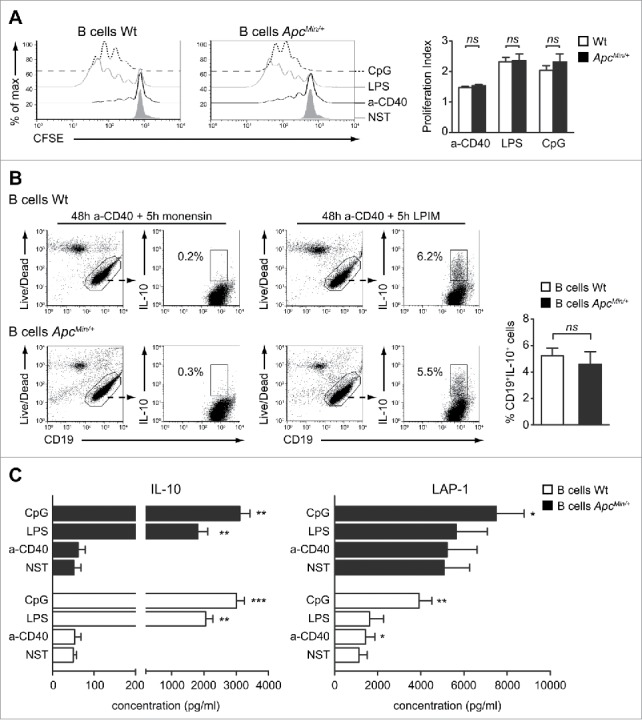
Wt and ApcMin/+ splenic B cells respond similarly to activating stimuli. (A) B cells were purified from the spleen of Wt and ApcMin/+ mice, CFSE labeled and cultured either alone (NST) or in the presence of anti-CD40 mAb (a-CD40), LPS or CpG for 72 h. CFSE profiles of B cell proliferation in the different conditions are shown for one representative experiment while bar graphs indicate mean (+ SEM) of the B cell proliferation index from 5 independent experiments. (B) The frequencies of B cells competent to express cytoplasmic IL-10 following a 5 h stimulation with LPIM were analyzed in purified Wt and ApcMin/+ B cells cultured for 48 h with anti-CD40 mAb. The condition in which cells received only monensin during the last 5 h of culture was used to correctly discriminate IL-10+ from IL-10− B cells. Dot plots for one representative experiment are shown together with the frequencies of IL-10+ cells among total CD19+ lymphocytes. Bar graphs indicate mean (+ SEM) percentages of CD19+IL-10+ cells from 6 independent experiments. (C) B cells were cultured either alone (NST) or in the presence of a-CD40 mAb, LPS or CpG for 48 h. Cell supernatants were collected and IL-10 and LAP-1 levels detected by ELISA. Bar graphs indicate mean (+ SEM) concentrations from 6 independent experiments and comparison were performed against the NST condition. *p < 0.05; **p < 0.01; ***p < 0.001; ns: not significant.
