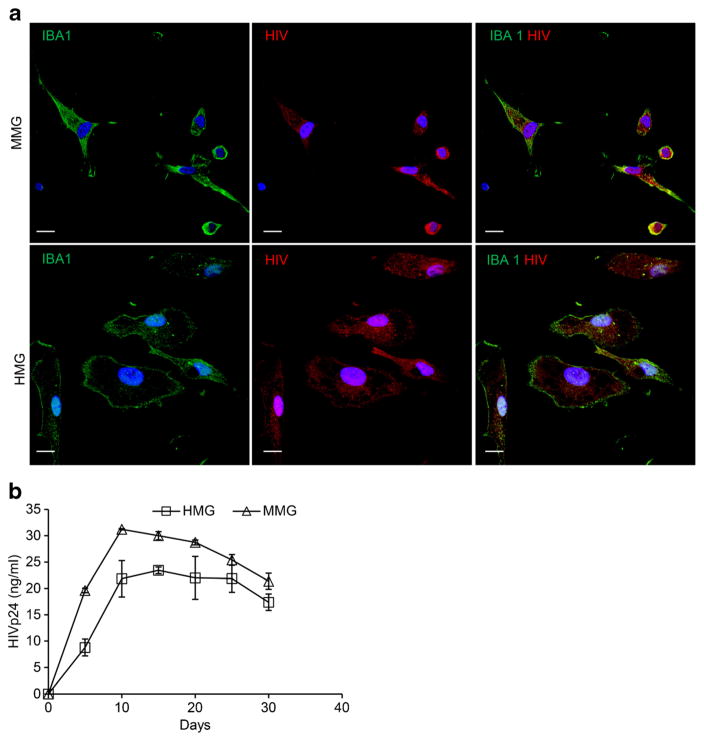
Fig. 8.
MMG and HMG cells show similar HIV infection kinetics. a Representative fluorescence microscopy images of HIV-infected MMG and HMG cells which were fixed, permeabilized, and then stained with antibody to IBA1 (green) and HIV p24 and p17 (red). Scale bar indicates 10 μm. b 0.5 million MMG and HMG cells were cultured in vitro for 10 days and then infected with HIVBa-L at MOI 0.1. Culture supernatants from HIV-infected MMG and HMG cells were collected at days 0, 5, 10, 15, 20, 25, and 30 post-infection and analyzed for p24 expression by p24 antigen capture ELISA. HIVBa-L infection profile was compared between MMG and HMG cells for 30 days post-infection. Data are presented as mean ± SD, n = 3

