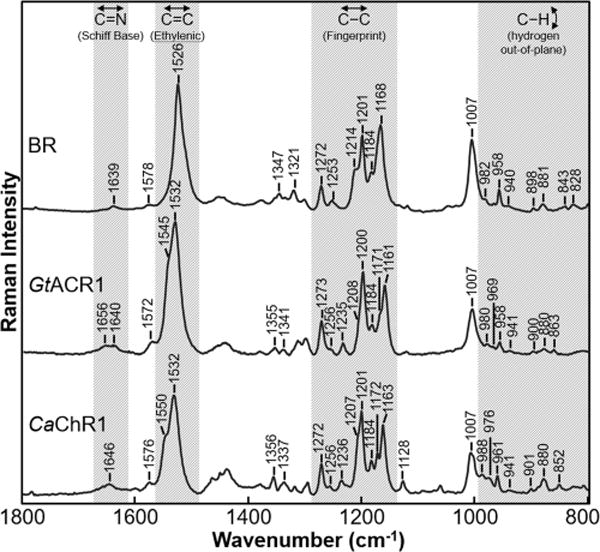
Figure 1.

RRS spectra of the BR (in the purple membrane), GtACR1, and CaChR1 (reconstituted into E. coli polar lipids). Data were recorded at room temperature using a 785 nm probe laser with a power of 100 mW (40 mW measured at the sample) for BR and CaChR1 and with a power of 300 mW (70 mW measured at the sample) for GtACR1. In this figure and Figures 2–5 and Supplementary Figures 6 and 7, except where noted, spectra were not smoothed and were scaled using the intensity of the peaks in the fingerprint region and a background spectrum of the borosilicate capillary and buffer was subtracted from the sample. Additional details are given in Materials and Methods.
