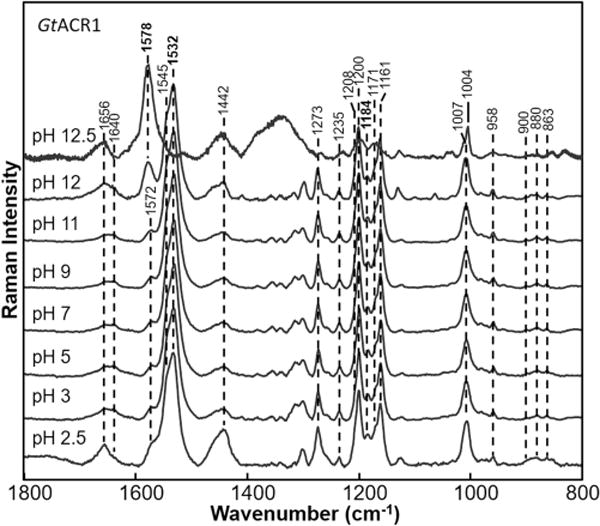
Figure 4.

Resonance Raman spectra of GtACR1 recorded at various pH values ranging from 2.5 to 12.5. Data were recorded at room temperature using a 785 nm probe laser with a 300 mW power (70 mW measured at the sample). Spectra were not smoothed and were scaled using the intensity of the peaks in the fingerprint region (except for pH 12.5, which was scaled using the protein band near 1004 cm−1).
