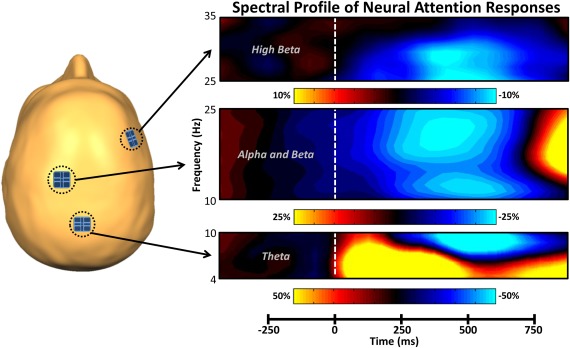
Figure 2.

Spectral time course of neural attention responses in the MEG sensor array. The schematic on the left indicates the spatial location of sensors of interest. On the right, time (in milliseconds) is denoted on the x‐axis, with 0 ms defined as the onset of the stimulus grid, and frequency (in Hz) is shown on the y‐axis. All signal power data are expressed as a percent difference from baseline (−460 to −60 ms), with each color legend underneath its respective spectrogram. All spectrograms represent group‐averaged data from gradiometer sensors that were representative of the neural response in each region. The same sensors were selected in all participants and their approximate location relative to the head is shown on the left. As is apparent, theta activity in occipital regions strongly increased (i.e., synchronized) shortly after the onset of the stimulus, while alpha, beta, and high beta activity were all strongly decreased (i.e., desynchronized) over more anterior regions. Time–frequency windows with significant oscillatory activity (relative to baseline) were subjected to beamforming. [Color figure can be viewed at http://wileyonlinelibrary.com]
