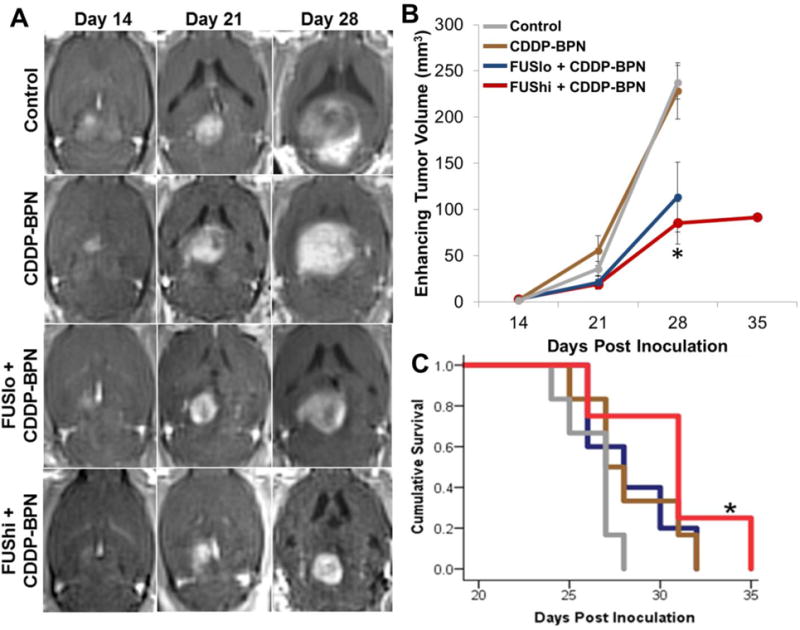
Figure 4. MR image-guided delivery of CDDP-BPN to F98 gliomas with 0.8 MPa FUS inhibits tumor growth and improves survival.

(A) Representative contrast-enhanced T1 weighted MR images taken before FUS application on Days 14, 21, and 28. Images show enhancing tumor volumes in untreated Control, CDDP-BPN, FUSlo + CDDP-BPN, and FUShi + CDDP-BPN treated rats. (B) Line graph of enhancing tumor volumes, taken from T1 weighted contrast MR images, for the 4 groups denoted in panel A. *P<0.05 vs. Control and CDDP-BPN groups. (C) Kaplan-Meier survival curves. *P<0.05 vs. Control. N≥4 for all groups.
