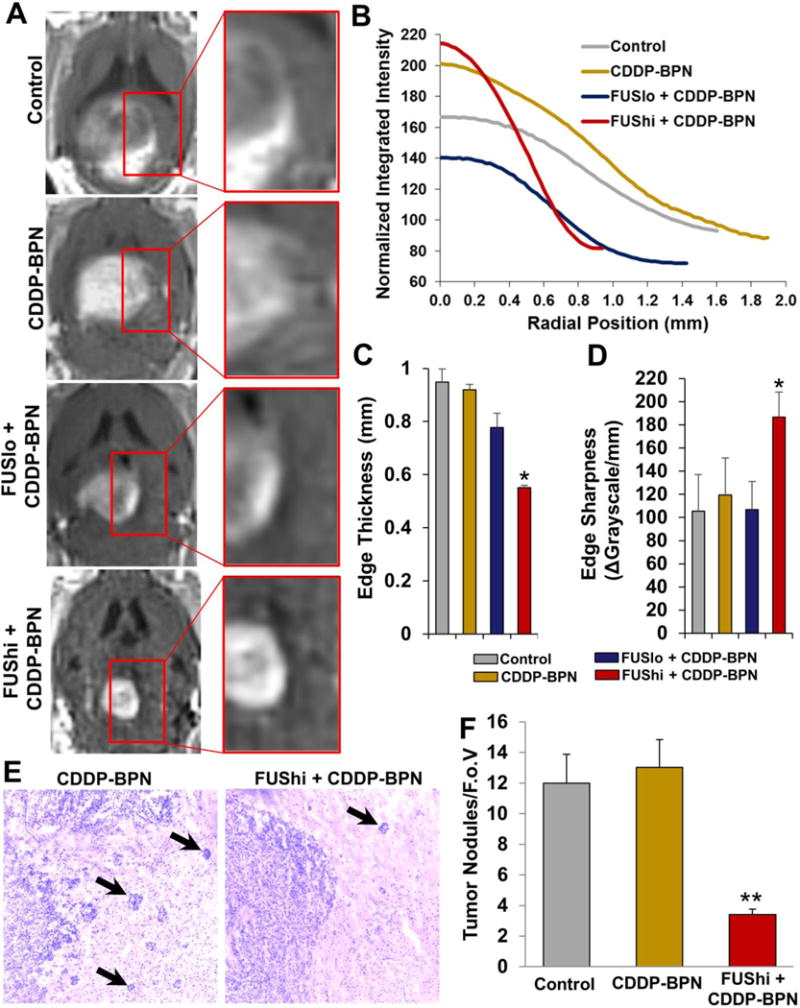
Figure 5. MR image-guided delivery of CDDP-BPN with FUS reduces the invasiveness of F98 gliomas.

(A) Representative contrast enhanced T1 weighted MR images taken from untreated Control, CDDP-BPN, FUSlo + CDDP-BPN, and FUShi + CDDP-BPN groups on Day 28. Insets show that the edge of the contrast enhancing region is more defined in the FUShi +CDDP-BPN treated F98 tumor when compared to the other 3 groups. (B) Radial intensity profiles acquired from the contrast MR images shown in the left column of panel A. Note that the linear region of the sigmoidal radial intensity profile from the FUShi + CDDP-BPN treated F98 glioma is considerably steeper than for the other 3 groups. Meanwhile, the width of the radial intensity profile is also reduced, indicating less infiltration into surrounding brain tissue. (C) Bar graph of tumor edge thickness for all 4 groups. *P<0.05 vs. all other groups. (D) Bar graph of tumor edge sharpness for all 4 groups. *P<0.05 vs. all other groups. (E) Representative transmitted light microscopic images of H&E stained cross-sections through F98 tumors from the CDDP-BPN and FUShi + CDDP-BPN groups. Note that the tumor border in the FUShi + CDDP-BPN image is well-defined compared to the CDDP-BPN image. Infiltrating tumor nodules are denoted with black arrows. (F) Bar graph of infiltrating tumor nodules per field of view (F.o.V.). **P<0.01 vs. all other groups. N≥4 for all groups.
