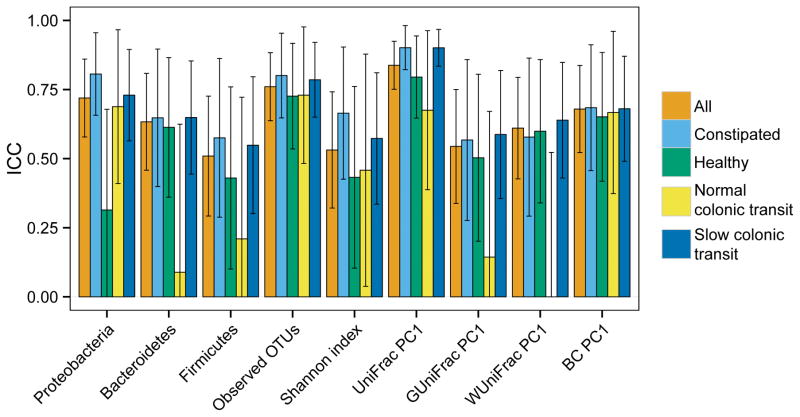
Figure 1.
Comparison of intraclass correlation coefficients (ICC) between two stool samples for different measures of fecal microbiota composition. The bars represent the absolute value of the ICC, i.e., the degree of similarity between the two stool samples for the corresponding measure microbiota composition. Most measures of alpha and beta diversity were similar across the 2 stool samples, and this was comparable in healthy participants and constipated patients.

