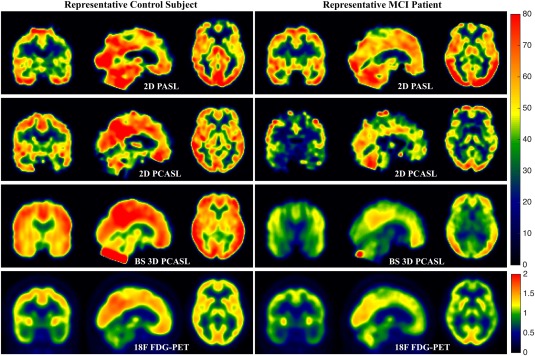
Figure 1.

Triaxial view of mean CBF maps using 2D PASL (Row 1), 2D PCASL (Row 2), and BS 3D PCASL (Row 3) of a representative control subject on the left and MCI patient on the right. The bottom row shows the SUVR maps of the same subjects. [Color figure can be viewed at http://wileyonlinelibrary.com]
