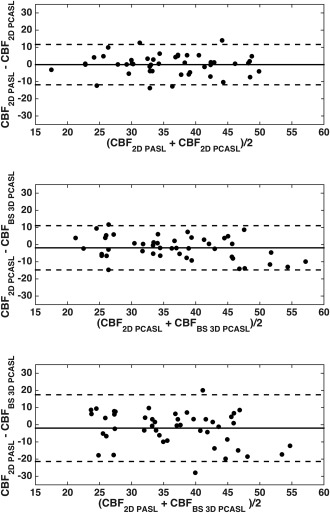
Figure 2.

Bland–Altman plots comparing the global CBF measurements obtained using (top) 2D PASL and 2D PCASL, (middle) 2D PCASL and BS 3D PCASL, and (bottom) 2D PASL and BS 3D PCASL. The three lines in each case show the mean difference and the 95% confidence intervals.
