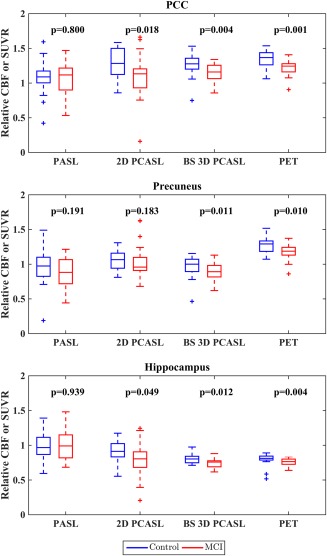
Figure 5.

Box plots of mean relative CBFs and mean SUVR in different ROIs shown in blue for controls and red for MCI patients. Within each box, the three horizontal lines represent the first quartile, the median, and the third quartile (bottom to top). The two horizontal lines outside each box represent the minimum and maximum values ignoring outliers. Outliers, determined as 1.5 times the interquartile range above (or below) the third (or first) quartile, are shown separately with “+” symbols. [Color figure can be viewed at http://wileyonlinelibrary.com]
