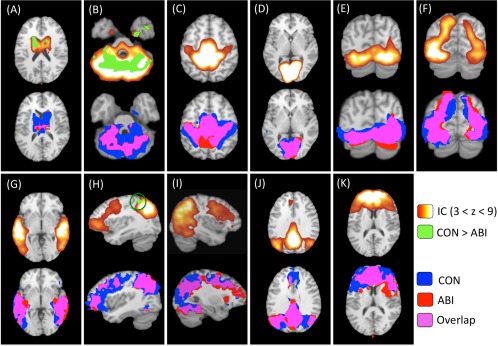
Figure 2.

Group independent components analysis and dual‐regression results. Top row: The 11 intrinsic connectivity networks (ICNs) of interest resulting from independent components analysis (ICA) of all subjects' data are shown on the top row of panels (A)–(K) in red–yellow–white. The identified ICNs are classified as follows: (A) basal ganglia; (B) cerebellum; (C) sensorimotor; (D) Visual 1; (E) Visual 2; (F) Visual 3; (G) auditory; (H) left frontoparietal; (I) right frontoparietal; (J) default mode; and (K) executive function. These ICNs were used to compute group contrasts and group‐specific maps per network. Between‐group differences (controls > patients) are overlaid onto the original ICN maps (top row) in green (P < 0.05, corrected for multiple comparisons). NB: significant between‐group differences were observed in three ICNs: (A) basal ganglia, (B) cerebellum, and (H) left frontoparietal. Bottom row: Group‐specific maps for each ICN are shown on the bottom row of each panel. Control group‐specific networks are displayed in blue; patient group‐specific networks are displayed in red; overlap between control and patient group networks is displayed in pink (P < 0.05). All images are overlaid onto the Talairach standard brain. IC, independent component; CON, control; ABI, anoxic brain injury.
