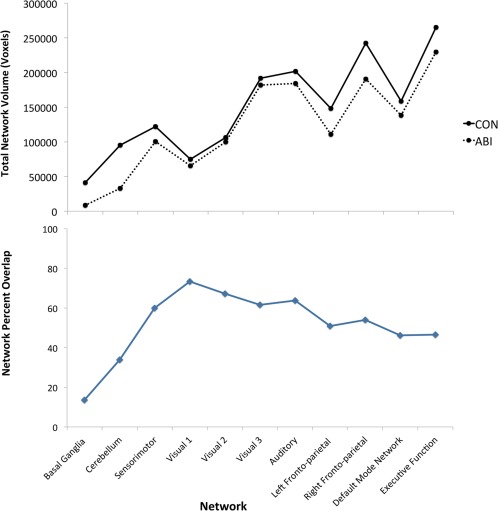
Figure 3.

Top: The total volume (in voxels) of each group‐specific intrinsic connectivity network (ICN) is shown for patient and control groups. Bottom: The percent overlap of each patient‐group ICN with the corresponding control‐group ICN is shown. CON, control; ABI, anoxic brain injury.
