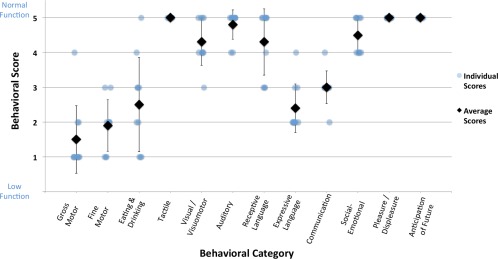
Figure 4.

Per‐subject ABI behavioral data. Per‐subject behavioral scores (with averages and standard deviations) for ABI patients are shown for 12 behavioral categories. The first 10 categories were assessed with a 1–5 scoring system (low–normal function); the last 2 categories were assessed with a Yes/No response (Yes = 5, No = 1). See Supporting Information for complete behavioral assessment form contents.
