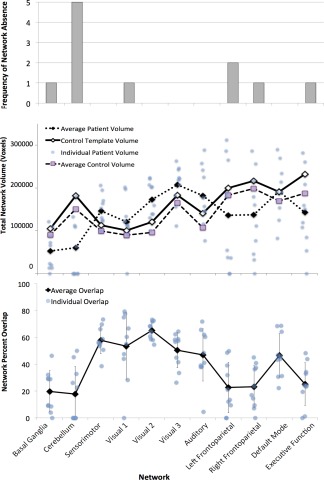
Figure 7.

Top: The frequency of network absence in individual patients' independent components analyses (ICA) is shown per intrinsic connectivity network (ICN). Middle: The total volume in voxels of each ICN is shown for individual patients. Total volume means for each ICN are shown for individual patient and control volumes. The volumes of ICN templates derived from the control group's ICA are also displayed. Bottom: The percent overlap of each patient's ICN with the corresponding template ICN is shown, along with means and standard deviations.
