
Figure 8.
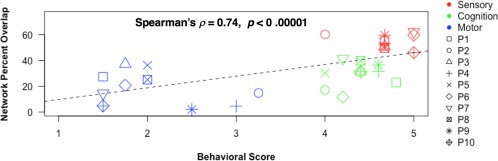
Imaging–behavioral correlation. Individual patients' network percent overlap values (with the corresponding network templates) are shown plotted against individual patients' behavioral scores, both averaged within motor, sensory, and cognition subgroups. Each symbol represents an individual patient (P1–P10), with 3 behavioral values and 3 network‐preservation values per patient. Motor = Basal Ganglia and Cerebellar networks; Gross Motor Function, Fine Motor Function, Eating & Drinking Ability, and Expressive Language Function behavioral categories. Sensory = Sensorimotor, Visual 1, Visual 2, Visual 3, and Auditory networks; Tactile Perception, Visual/Visuomotor Function, and Auditory Function behavioral categories. Cognition = Left Frontoparietal, Right Frontoparietal, Default Mode, and Executive Function networks; Receptive Language Function, Overall Communication, Social‐Emotional Responsiveness, Expression of Pleasure/Displeasure, and Anticipation of the Future behavioral categories.