
Figure 3. ILF2 Levels Modulate MM Cell Sensitivity to DNA-Damaging Agents.
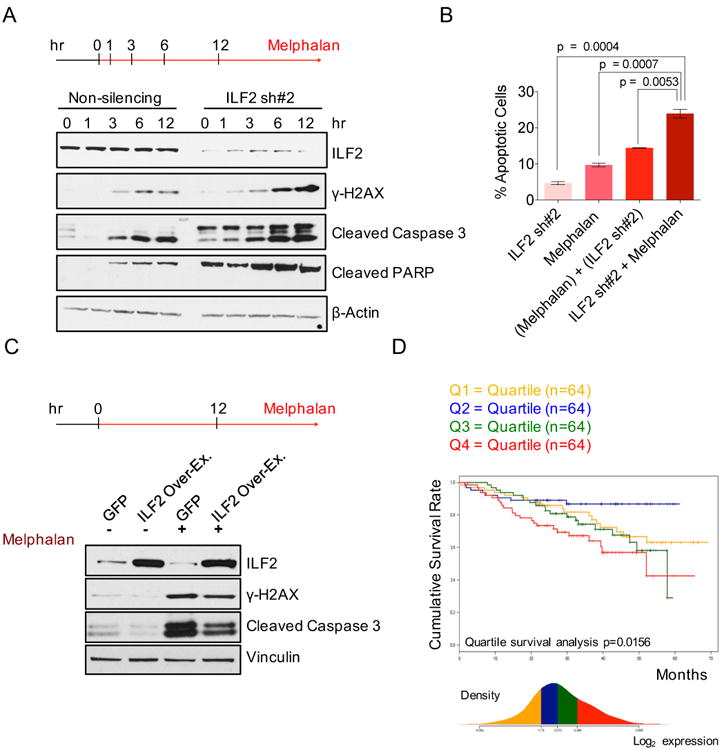
(A) Western blot analysis of ILF2, γH2AX, cleaved caspase 3, and cleaved PARP proteins in non-silencing and ILF2 shRNA #2-transduced JJN3 cells treated with 25 μM melphalan for the indicated times. β-actin was used as the loading control.
(B) Quantitative analysis of the frequency of apoptosis of non-silencing and ILF2 shRNA–transduced JJN3 cells that were treated with 4 μM melphalan for 48 hr. ILF2 shRNA #2 (ILF2 sh#2) was used for this experiment. ILF2 sh#2 indicates the frequency of apoptosis induced by ILF2 depletion; melphalan indicates the frequency of apoptosis induced by melphalan; (melphalan) + (ILF2 sh#2) indicates the sum frequency of apoptosis induced by ILF2 depletion and by melphalan; ILF2 sh#2 + melphalan indicates the frequency of apoptosis of melphalan-treated, ILF2 shRNA–transduced cells. The mean and SD of triplicates from one representative experiment are shown.
(C) Western blot analysis of ILF2, γH2AX, and cleaved caspase 3 proteins in GFP- and ILF2-overexpressing JJN3 cells treated with 25 μM melphalan for 12 hr. Vinculin was used as the loading control.
(D) Cumulative survival rate of 256 newly diagnosed MM patients subsequently treated with high-dose chemotherapy and stem cell transplantation (MM patients were enrolled in the Arkansas Total Therapy 2 trial). Patients were stratified in quartiles based on ILF2 expression as evaluated by microarray analysis.
See also Figure S3.