
Figure 5. ILF2 Modulates DNA Damage–Induced YB-1 Nuclear Translocation and Splicing Regulation.
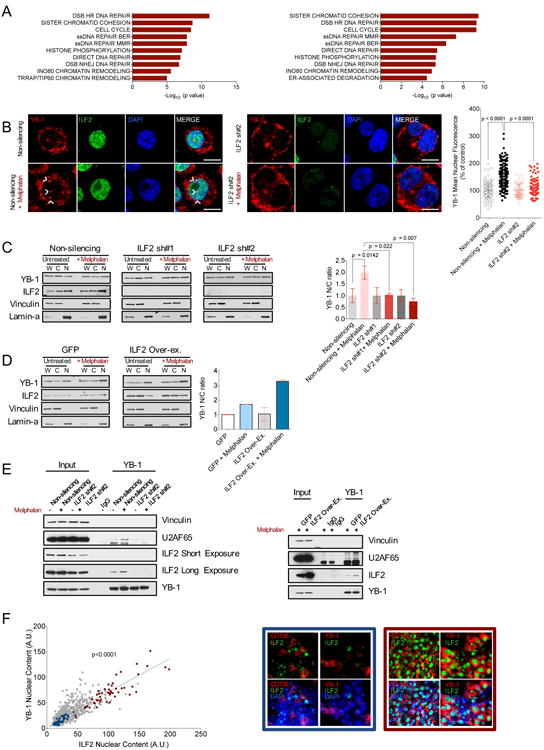
(A) Significantly enriched pathways relative to the transcripts bound to ILF2 in both untreated (left) and in both melphalan-treated (right) JJN3 and H929 cell lines. The experiment was performed in duplicate.
(B) Representative confocal microscopy images of anti–YB-1 and anti-ILF2 immunofluorescence in untreated or melphalan-treated non-silencing (left two rows) or ILF2 shRNA–transduced JJN3 cells (middle two rows); anti–YB-1: red; anti-ILF2: green; DAPI: blue; scale bars represent 10 μm. Confocal microscopy quantification of YB-1 nuclear fluorescence in untreated or melphalan-treated non-silencing or ILF2 shRNA-transduced JJN3 cells. Data are expressed as percentages of the corresponding untreated controls; error bars denote SD (panel on the right).
(C) Representative Western blot analysis of ILF2 and YB-1 proteins in the whole extracts (W) and in nuclear (N) and cytoplasmic (C) fractions as well as quantification of YB-1 nuclear/cytoplasmic (N/C) ratio in untreated and melphalan-treated non-silencing or ILF2 shRNA–transduced JJN3 cells. Vinculin was used as the loading control for the whole extracts and cytoplasmic fractions and lamin-A was used as the loading control for the nuclear fractions. YB-1 nuclear expression was normalized to lamin-A nuclear expression, and YB-1 cytoplasmic expression was normalized to vinculin cytoplasmic expression. YB-1 nuclear/cytoplasmic ratios were expressed as percentages of the untreated corresponding controls. The mean and SD of three independent experiments are shown (panel on the right).
(D) Western blot analysis of ILF2 and YB-1 proteins in the whole extracts (W) and in nuclear (N) and cytoplasmic (C) fractions and quantification of YB-1 nuclear/cytoplasmic (N/C) ratio in untreated and melphalan-treated GFP- or ILF2-overexpressing JJN3 cells. Vinculin was used as the loading control for the whole extract and cytoplasmic fraction and lamin-A was used as the loading control for the nuclear fraction. YB-1 nuclear expression was normalized to lamin-A nuclear expression and YB-1 cytoplasmic expression was normalized to vinculin cytoplasmic expression; YB-1 nuclear/cytoplasmic ratios were expressed as percentages of the untreated corresponding controls. The mean and SD of two independent experiments are shown (panel on the right).
(E) Western blot analysis of vinculin, U2AF65, ILF2 (short or long exposure), and YB-1 in the lysates isolated from untreated and melphalan-treated non-silencing and ILF2 shRNA–transduced JJN3 cells (input) and immunoprecipitated with anti-IgG or anti–YB-1 antibodies (left). Western blot analysis of vinculin, U2AF65, ILF2, and YB-1 in the lysates isolated from melphalan-treated GFP- and ILF2-overexpressing JJN3 cells (input) and immunoprecipitated with anti-IgG or anti–YB-1 antibodies (right).
(F) Quantitative immunofluorescence analysis of ILF2 and YB-1 nuclear expression in 15 BM biopsy specimens from 14 MM patients. A.U. stands for arbitrary unit; every spot indicates ILF2 and YB-1 expression in a specific nucleus; blue spots indicate ILF2 and YB-1 nuclear expression in the plasma cells of a MM patient with lower expression of ILF2; red spots indicate ILF2 and YB-1 nuclear expression in the plasma cells of an MM patient with higher expression of ILF2 (left). Representative anti-CD138, anti-ILF2, and anti–YB-1 immunofluorescence in the biopsy specimens of MM patients with lower (blue square) or higher (red square) ILF2 nuclear expression; CD138 and YB-1: red; ILF2: green; DAPI: blue; scale bars represent 10 μm.