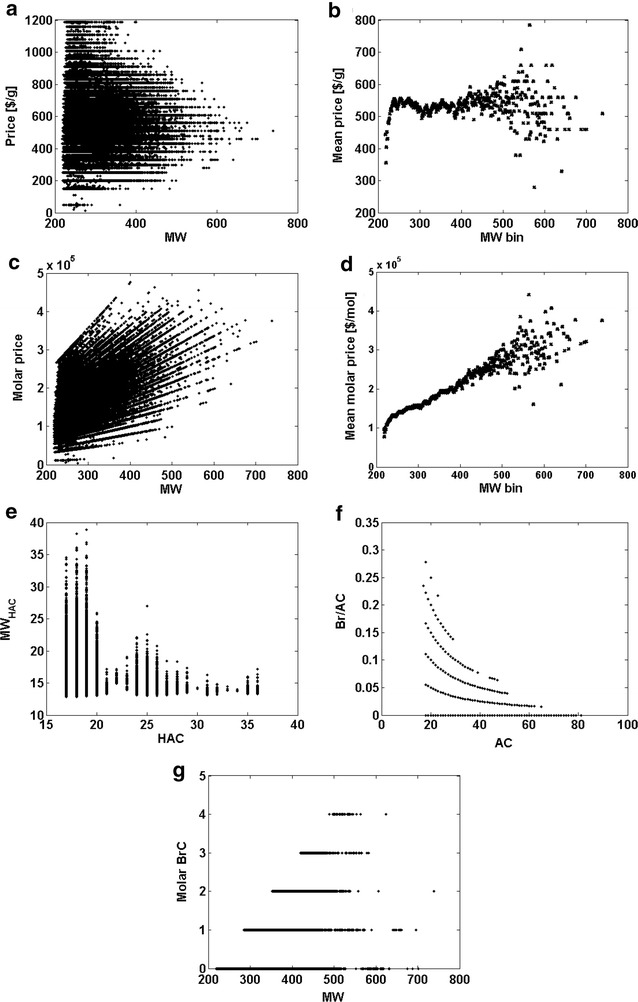
Fig. 3.

Selected descriptors of the ca. 2.5 mln library data for chemical compounds according to Ref. [10]. a–d Market prices plotted versus MW a weight price ($/g) versus MW, b binned statistics of mean price ($/g) versus MW bin, c molar price ($/mol) versus MW, d binned statistics of mean molar price ($/mol) versus MW bin. Selected efficiency descriptors (e–g): e MW/HAC versus HAC, f Br/AC versus AC, g molar BrC versus MW
