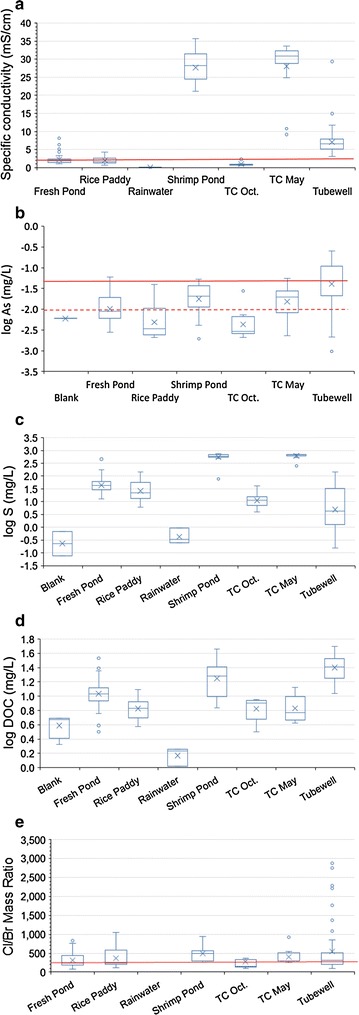
Fig. 5.

Box and whisker plots of water compositions classified by water type. “TC” indicates tidal channel. In all plots the horizontal line inside the box represents the median. The boxes’ lower boundary is the 25th percentile and upper boundary the 75th percentile. The sample mean is an “x” symbol. The “whiskers” extend to 1.5 times the interquartile range above and below the box, and outliers that plot outside the interquartile range are shown as circles. Tubewell groundwater sample data from [12]. a Specific conductivity in mS/cm measured in the field using a Hydrolab. For reference, the conductivity of pure seawater is ~50 mS/cm. The Bangladesh government drinking water guideline of 2 mS/cm is shown as a horizontal red line. b log10 values of arsenic concentrations in mg/L. The solid red line corresponds to the Bangladesh government drinking water guideline of 50 μg/L, and the dashed red line indicates the WHO guideline of 10 μg/L. Arsenic in rainwater was below detection. c log10 values of sulfur concentrations in mg/L. d log10 values of dissolved organic carbon concentrations in mg/L. e Cl/Br mass ratio. The solid red line corresponds to seawater
