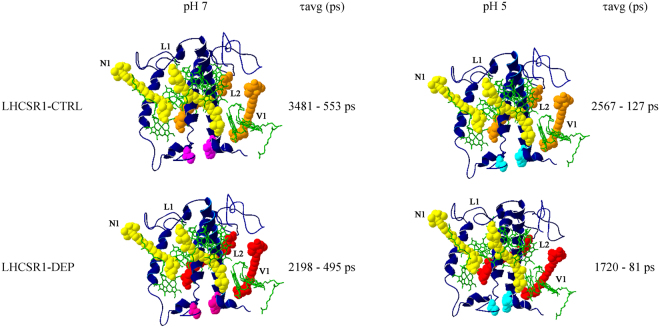
Figure 8.
Proposed model for LHCSR1 conformational change during activation of quenching. LHCSR1 structure was modeled based on crystallographic structures of LHCII and CP29. The average fluorescence lifetimes (τAVG) at low and high detergent concentration and a different pH are shown for both LHCSR1-ctrl (upper panel) and -dep (lowe panel); green, chlorophylls; yellow, lutein; orange, violaxanthin; red, zeaxanthin. Prononatable residues exposed to the lumenal side are indicated in pink and at pH 7.5 and in cyan at pH 5.0. The 3D structure is obtained by homology with CP29 and LHCII and does not account for the structural changes undergone during quenching activation: it is only meant to depict the sites of xanthophyll conversion.

