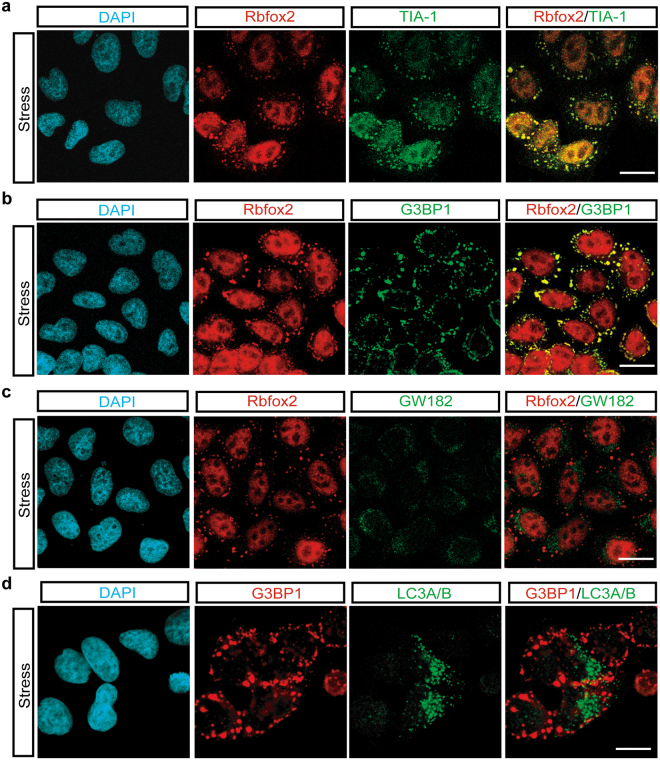
Figure 2.
Recruitment of Rbfox2 protein into SGs by sodium arsenite treatment. (a) Immunofluorescence images of Rbfox2 (red) and TIA-1 (green) proteins were visualized in sodium arsenite-treated (500 μM; 40 min) HeLa cells (Stress). (b) Immunofluorescence images of Rbfox2 (red) and SG marker G3BP1 (green) proteins in sodium arsenite-treated HeLa cells. (c) Immunofluorescence images of Rbfox2 (red) and P-body marker GW182 (green) proteins were visualized in sodium arsenite-treated (500 μM; 40 min) HeLa cells (Stress). (d) Immunofluorescence images of G3BP1 (red) and autophagy marker LC3A/B (green) proteins were visualized in sodium arsenite-treated (500 μM; 40 min) HeLa cells (Stress). DAPI stains nuclei. Scale bar, 20 μm.

