Figure 7.
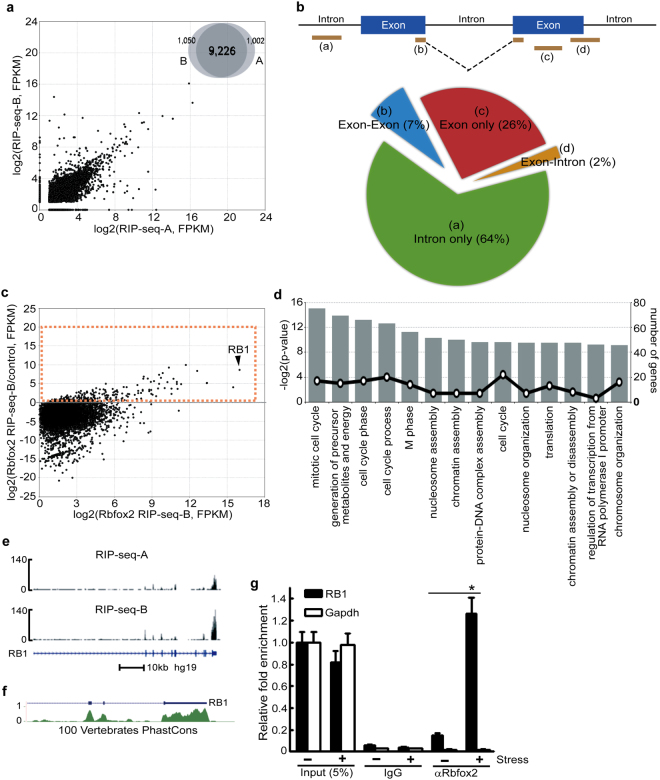
Identification of Rbfox2 target RNAs using RIP-seq analysis. (a) Correlation of RNA levels (log2(FPKM RIP-seq)) between two replicates. Venn diagram indicates the total number of Rbfox2 binding RNAs by both experimental conditions (RIP-seq-A and RIP-seq-B). (b) The distribution of Rbfox2 binding sites. (c) Correlation of expression level log fold change between Rbfox2 RIP-seq and control RNA-sequencing. The dashed rectangle indicates enriched RNAs (fold change ≥ 2) in Rbfox2 RIP-seq compared to control. (d) Gene Ontology (GO) analysis of enriched RNAs shown in the dashed rectangle of (c). The 14 most enriched GO biological process categories are shown. (e) An integrative genomics viewer (IGV) browser snapshot of Rbfox2 occupancy within the RB1 locus in two biological replicates (RIP-seq-A and RIP-seq-B) for RIP-seq analysis. (f) Phylogenetic conservation of 3′ UTR of RB1. Conservation of the RB1 targeting 3′ UTR is shown by the phastCons track on the UCSC Genome Browser in the human hg19 genome. The phastCons score estimates the probability of each nucleotide, using a hidden markov model-based method, belonging to conserved elements. This track shows multiple alignments of 100 vertebrate species and measurements of evolution conservation. (g) After treatment of HeLa cells with sodium arsenite, RIP-qRT-PCR (IP followed by qRT-PCR) analysis was used to measure the levels of enrichment of RB1 mRNA and GAPDH mRNA associated with immune-complexes using anti-Rbfox2 (αRbfox2) or control IgG; the data represented as enrichment of each mRNA in immuno-complexes were compared with 5% input. Mean values ± SD (error bars) are shown for three independent experiments. *P < 0.01 (two-sided t test), comparing stressed with unstressed RB1 mRNAs.

