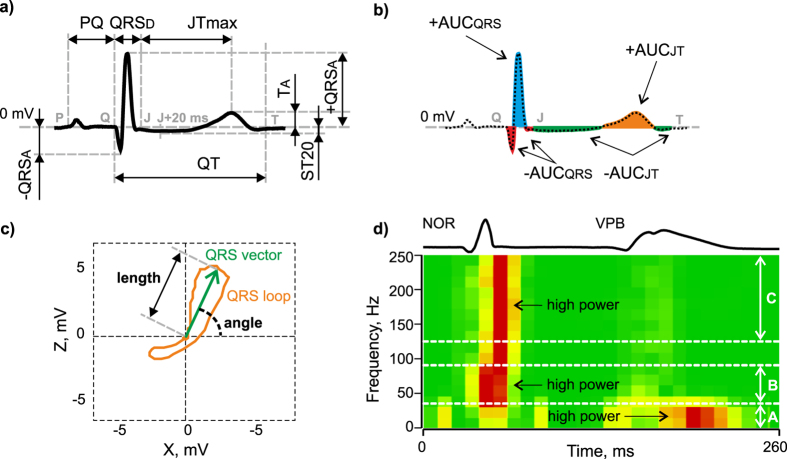
Figure 4.
Selected features definition: (a) interval (QRSD, QT, PQ, and JTmax represent the duration of QRS complex, QT interval, PQ interval, and segment between J point and maximal deviation of T wave, respectively) and voltage (+QRSA, −QRSA, TA, and ST20 represent maximal positive deviation of QRS, maximal negative deviation of QRS, maximal deviation of ST-T interval, and deviation of ST segment 20 ms after QRS offset, respectively) characteristics of ECG; (b) areas under various parts of QRS-T (−AUCQRS, +AUCQRS, −AUCJT, and +AUCJT represent area under negative and positive part of QRS and negative and positive part of ST-T interval, respectively); (c) 2D QRS loop parameters (length and angle of maximal electrical vector of QRS in horizontal plane); (d) spectrogram of QRS used for calculation of (sum of frequency power (normalized for each frequency component separately - created by28) in three bands (A – 0–35 Hz, B – 35–90 Hz and C – 125–250 Hz); NOR, VPB - normal and ventricular premature beats, respectively.

