Figure 2.
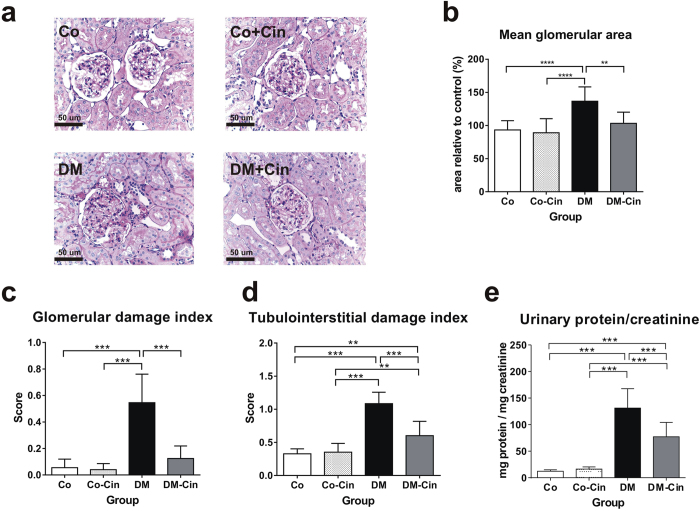
Effect of cinaciguat on kidney histology and proteinuria in diabetic rats. (a,b) Representative photomicrographs of PAS stained kidneys (400x magnification) show normal glomerular structure in both Co and Co-Cin controls, mesangial expansion and glomerular hypertrophy in DM and almost normal structure in DM-Cin groups (scale bar represents 50 μm). (c,d) Glomerular and tubulointerstitial damage index scores of each group are shown. (e) The extent of proteinuria was determined by urinary protein/creatinine ratio (mg protein/mg creatinine), showing significant proteinuria in DM that was reduced in DM-Cin rats. Data are presented as mean ± SD (n = 8–10/group). **p < 0.01, ***p < 0.001 (two-way ANOVA with Sidak’s multiple comparison test).

