Fig. 2.
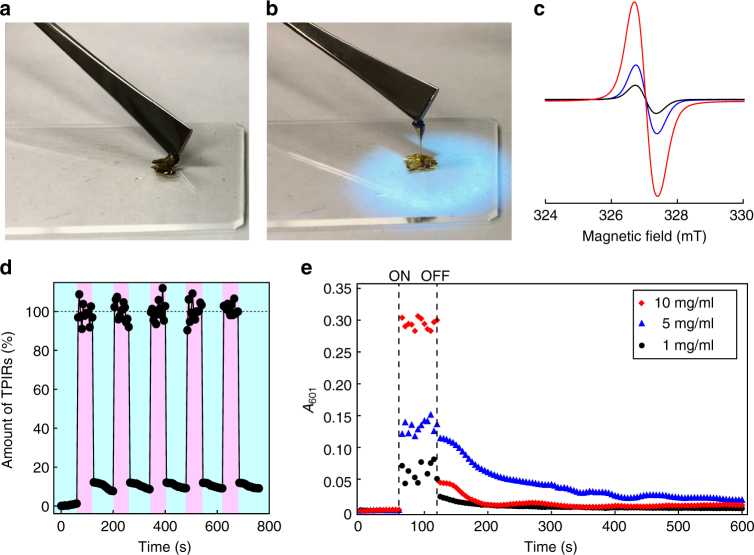
IRLNC experiment with network-PBA HABI network-PBAHABI. Photographs of network-PBA HABI a before and b after UV irradiation. c ESR spectra of network-PBA HABI before (black) and during (red) UV irradiation for 1 min, and 1 min after terminating UV irradiation (blue). d Time-dependent plots of the amounts of TPIR in a THF solution of network-PBA HABI (10 mg/ml). The amount of TPIR was determined by recording A 601 every 5 s. The sample was irradiated with UV and not irradiated with UV during times corresponding to the pink and light blue regions, respectively. The value of A 601 before UV irradiation was defined as 0% and the averaged A 601 during UV irradiation was defined as 100%. e Time-dependent plots of absorbance at 601 nm for network-PBA HABI in THF. Initial network-PBA HABI concentration was 1 mg/ml (black circle), 5 mg/ml (blue triangle), and 10 mg/ml (red diamond), respectively. The starting (ON) and terminating (OFF) times of UV irradiation were indicated with dashed lines

