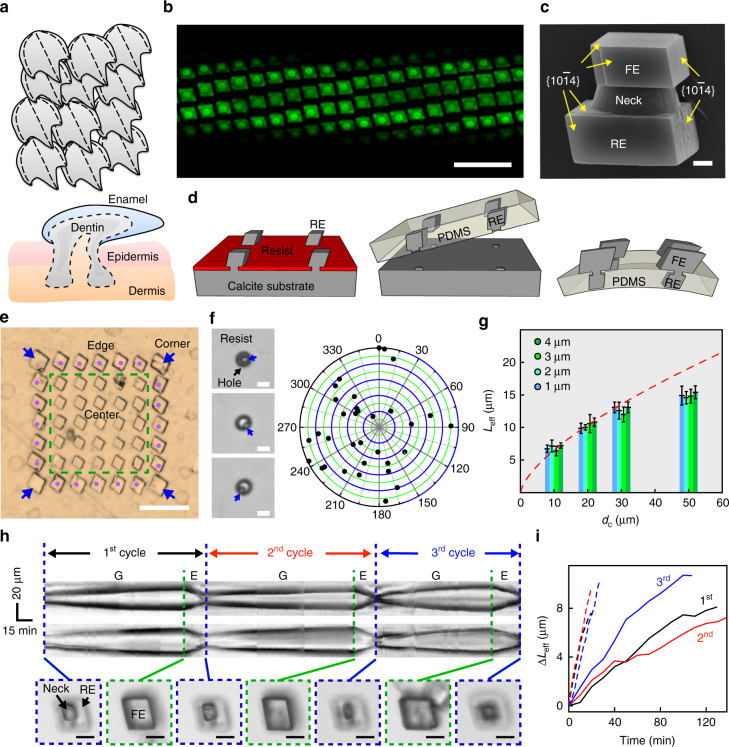
Fig. 1.
3D calcite building blocks and their growth kinetics. a Schematic representation of placoid scales, showing heterojunctions and compartments. The lower portion of dentin is rooted in a pocket of epidermis/dermis. b Confocal fluorescence microscope image of a deformable, FITC-BSA-doped calcite matrix. Scale bar, 40 μm. c SEM image of a calcite heterostructure grown by a tectonic approach, showing an RE, a neck and an FE. Scale bar, 1 μm. d Schematic representation of mineral matrix fabrication. e Optical microscopy image of a 7 × 7 calcite crystal array. Scale bar, 50 μm. Blue arrows, corner; magenta dots, edge; within green dashed box, center. f Optical microscopy images (left) and distribution mapping (right) of nucleation in the hole pattern. Scale bars, 5 μm. Blue arrows mark the crystallites right after nucleation. g Neck size-dependent L eff − d c plot, only center region calcites were considered. Red dashed line is the kinetics fitting. Error bar indicates standard deviation (n = 14). L eff is defined in the Supplementary Fig. 7. h Kymographs (upper and middle) showing mutable behaviors of a calcite building block, recorded along cross-sections parallel with the top/down (upper) and left/right (middle) crystal edges. Bottom, snapshots at the transition time points; scale bars, 10 μm. ‘G’ and ‘E’ denote growth and etching, respectively. i L eff—reaction time plot for the mutable calcite in h. Solid and dashed lines denote the growth and etching behaviors, respectively. Black, red and blue are kinetics during the first, second and third cycles

