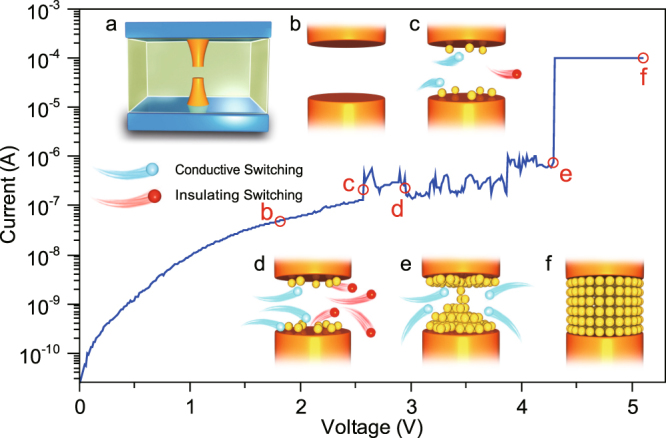
Figure 1.

Typical experimental I − V curve showing abrupt SET switching and the corresponding different stages of CF formation. Inset (a) Schematic of a RRAM device with remnant CFs in the insulating layer. Insets (b–f) Magnified schematics of the gap region in the CF during the SET process, including (b) the initial open gap in HRS, the intermediate filament growth with conductive cells gradually (c) increasing and (d) decreasing and giving rise to current fluctuations, (e) the just formed tiny CF with one column of cells connected (quantum wire limit), and (f) the strong CF in LRS after the constant I cc stage, respectively. It is worth noting that the remnant CFs keep comparatively stable during the evolution. This figure also illustrates the geometrical approach of the cell-based model. Our simulator only deals with the dynamic modeling of the CF evolution by considering the gap region (fully insulating in the HRS), which, for convenience, is divided into n slices with each slice including N cells. The parameter n is related to the gap thickness (or gap length) and it is the key parameter in the model.
