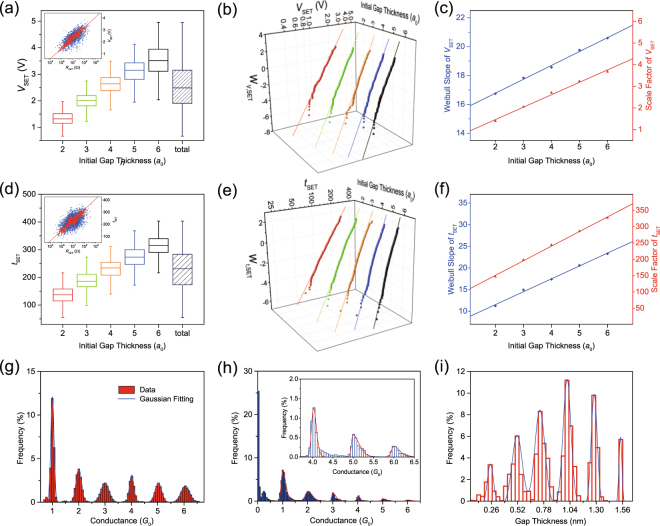
Figure 4.
Statistical results of Monte Carlo simulation under VSM, CSV and GVR. (a) Box plot of V SET extracted from 3000 cycles for different initial values of n. The distribution of all the points is shown in the “total” column. Inset of (a) The scatter plot showing the relationship between R OFF and V SET (blue dots) and moving geometric mean (red dots), by calculating the geomean of 20 adjacent voltage values. (b) Weibull distributions of V SET in 3000 cycles for different n. (c) Weibull slope and scale factor extracted from (b). Both parameters are linearly dependent on n. (d–f) The distribution of t SET under CSV. (g,h) Histogram of conductance distribution (when G > G 0) in 100 continuous cycles under VSM and GVR, showing Gaussian distribution and skew normal distribution, respectively. Inset of (h) The magnified histogram when G > 3.5G 0. (i) The distribution of gap thickness (when G < G 0).

