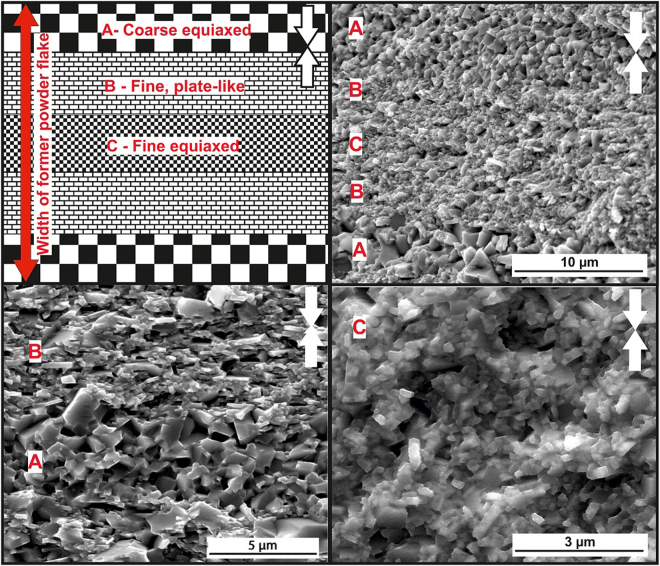
Figure 7.
(Top left) diagram illustrating the typical microstructure observed at low magnification across the full width of a MQU-F powder flake, showing coarse equiaxed (A), plate-like aligned (B) and fine equiaxed (C) layers in the best initial FSPS sample (19 kW). The rest of the images are SEM secondary electron images taken from the fracture surface of the 19 kW FSPS sample, showing typical images of the different layers. White arrows indicate the pressing direction.

