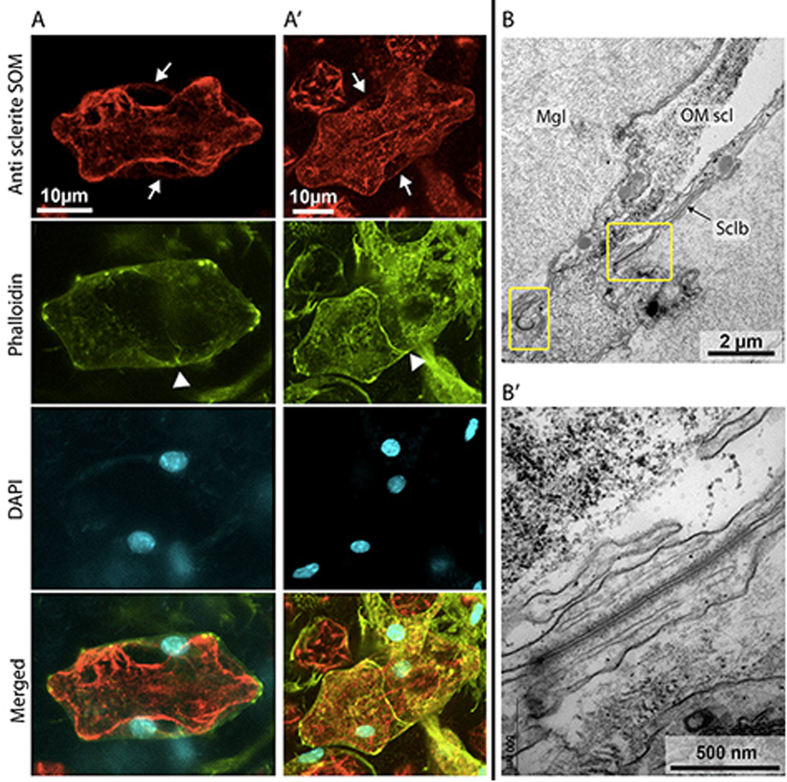
Figure 5.
Observation of growing sclerites and their cellular environment by confocal microscopy and TEM. (A-A’) Confocal images of growing sclerites labeled with anti sclerite SOM (red), and scleroblasts labeled with Phalloidin (actin, green) and DAPI (nuclei, blue). Arrows suggest the secretion of OM at the level of scleroblasts membranes. Arrowheads show junction between scleroblasts. The merged images show the cellular environment of growing sclerites, surrounded by two scleroblasts. (A) Observation of a section along the optical axis Z in a sclerite. (A’) Maximum intensity projection (MIP) of a z-stack of multiple optical sections with a 0.2 µm step between them. (B-B’) TEM images of a transversal section in a C. rubrum microcolony showing septate junctions between two scleroblasts. (B) Sclerite in the mesoglea surrounded by two scleroblasts. Yellow boxes indicate the presence of two septate junctions. (B’) Enlargement showing a septate junction between two scleroblasts. Mgl: Mesoglea; OM scl: Organic matrix of sclerite; Sclb: Scleroblasts.

