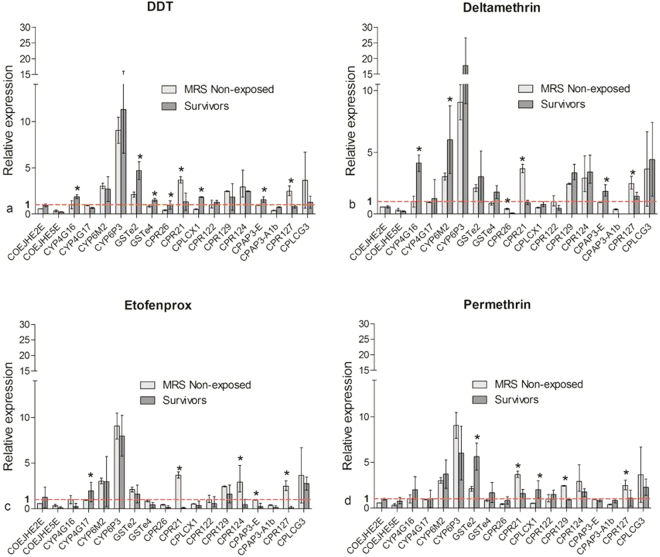
Figure 2.
Relative expressions of detoxification and cuticle genes in MRS unexposed to and survivors of DDT (a), Deltamethrin (b), Etofenprox (c) and Permethrin (d). Bar plots represent the mean fold changes and error bars the standard deviations. Fold changes were determined by the ΔΔCt method with the susceptible reference Kisumu as calibrator. The bars above the dotted line (fold change = 1) represent upregulation, those under downregulation. The fold changes from three biological replicates and two independent experiments of both groups were compared using the Mann-Whitney U-test. *Significant difference (p-value < 0.05).

