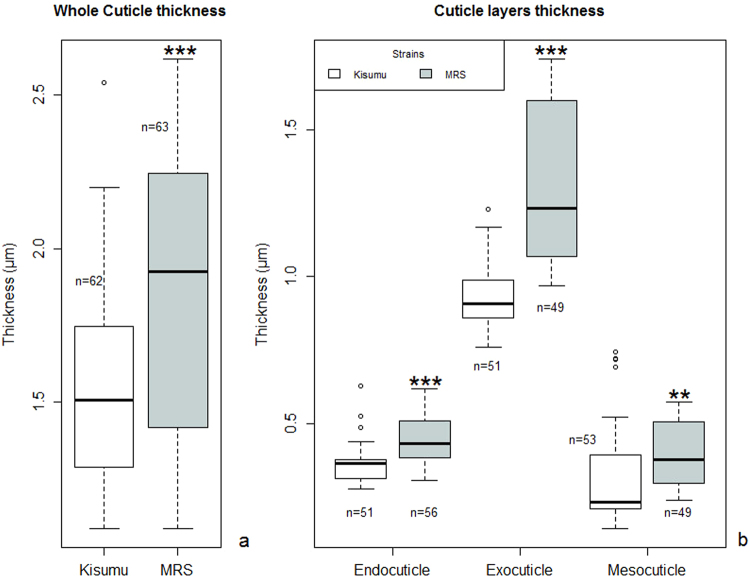
Figure 4.
Cuticle thickness in resistant MRS and susceptible Kisumu measured by transmission electron microscope. Thicknesses of the whole cuticle (a) and of its various layers (b) were measured with an Image J 1.49. Box plots represent the minimum and maximum quartiles, dots the outlying data. n = the number of measures carried out on each batch of 20 mosquitoes (Kisumu & MRS). *p-value < 0.05, **p-value < 0.01, ***p-value < 0.001 according to a Wilcoxon rank sum test.

