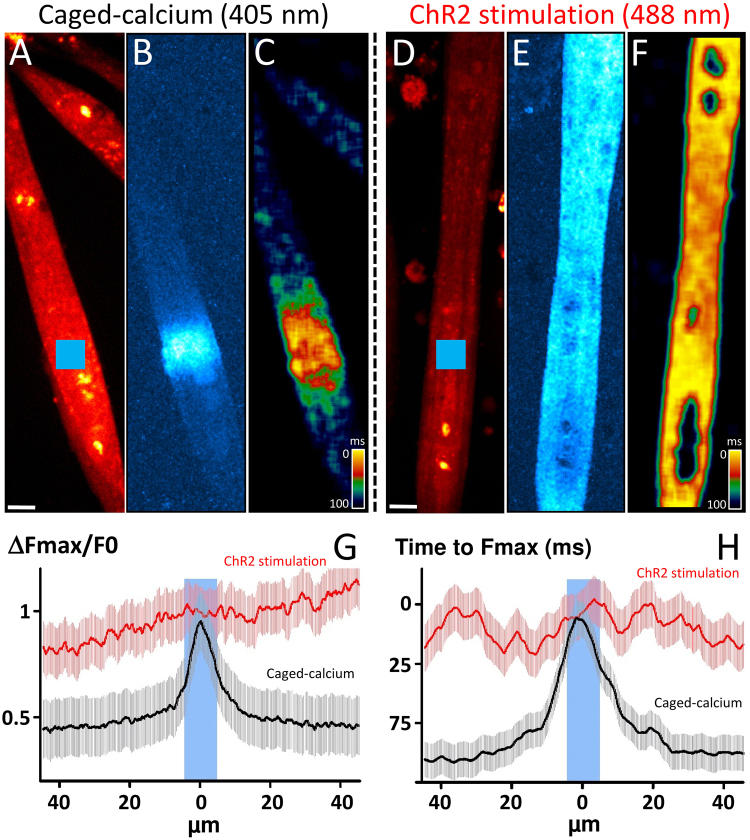
Figure 5.
Comparison between Ca2+ increases induced by photorelease of caged-compound (uncaging) and by optogenetic stimulation. In each condition, time sequences of 350 fast confocal images (1 image every 24 ms) have been recorded in Rhod2–loaded myotubes. Bars: 10 µm. Uncaging: Frames of fluorescence were obtained from C2C12 myotubes loaded with Rhod-2-AM and NP-EGTA-AM. (A) Image of mean fluorescence obtained in a C2C12 before flash. The blue square represents the area of photolysis (10 × 10 µm) with a 405 nm laser line. Bar, 10 µm. A single pulse was delivered during the trial. (B) Image computed from the image series and displaying the maximum of fluorescence, in the sequence, from each pixel normalized with the fluorescence before photolysis (ΔF/F0). (D) Image computed from the image series and displaying, in each pixel, the duration between the trial and the time needed to get the maximum of fluorescence obtained in (B). Inverted pseudo color scale displays therefore, in yellow, short durations, meaning a maximum obtained very early after photolysis and in blue longer durations, meaning a maximum obtained lately after photolysis. Hence, this image represents propagation properties of the calcium increase. Optogenetic stimulation: Frames of fluorescence were obtained from ChR2-C2C12 myotubes loaded with Rhod-2-AM. (D) Image of mean fluorescence obtained in a C2C12 before light stimulation. The blue square represents the area of stimulation (10 × 10 µm) with a 488 nm laser line. Bar, 10 µm. A single pulse was delivered during the trial. (E) Image computed from the image series and displaying the maximum of fluorescence, in the sequence, from each pixel normalized with the fluorescence before photolysis (ΔF/F0). (F) Image computed from the image series and displaying, in each pixel, the duration between the trial and the time needed to get the maximum of fluorescence obtained in E. (G) Spatial representation of the relative maximum fluorescence measured from either side of the stimulation on several cells during the ChR2 stimulation (n = 12 cells) or Caged-calcium stimulation (n = 15 cells). (H) Spatial representation of the time to reach the maximum fluorescence around the stimulation on the same cells.

