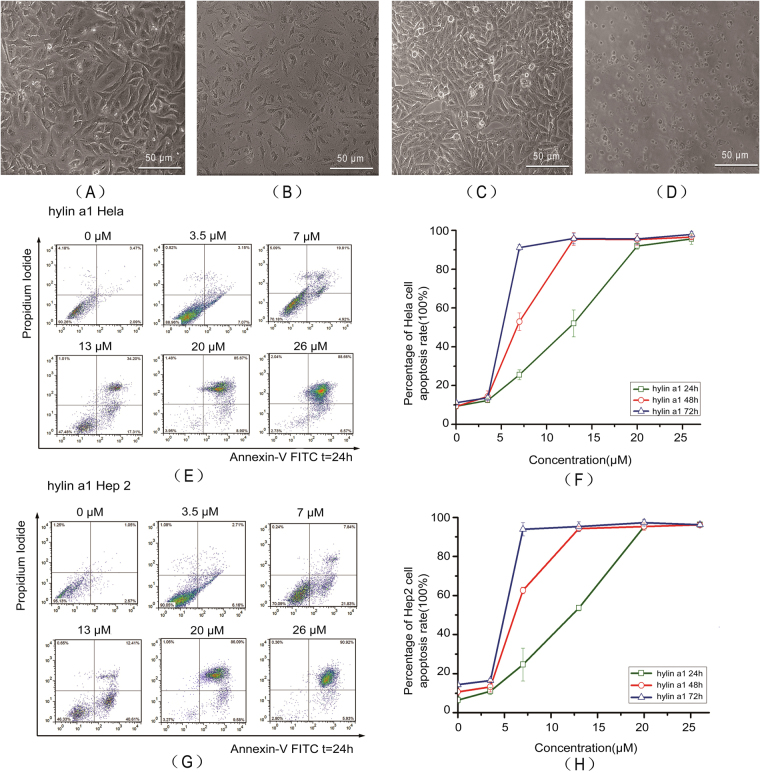
Figure 1.
Hylin a1 cytotoxicity assays in Hela and Hep2 cells in vitro. Cellular morphology was observed by 10 × inverted microscope. All data was presented as the means ± SD, n = 3. (A) Hela cells grew for 24 h. (B) Hela cells were treated with 20 μM hylin a1 for 24 h. (C) Hep2 cells grew for 24 h. (D) Hep2 cells were treated with 20 μM hylin a1 for 24 h. (E) and (F) Apoptosis assays evaluating the cytotoxicity of hylin a1 in Hela cells. (G) and (H) Apoptosis assays evaluating the cytotoxicity of hylin a1 in Hep2 cells.

