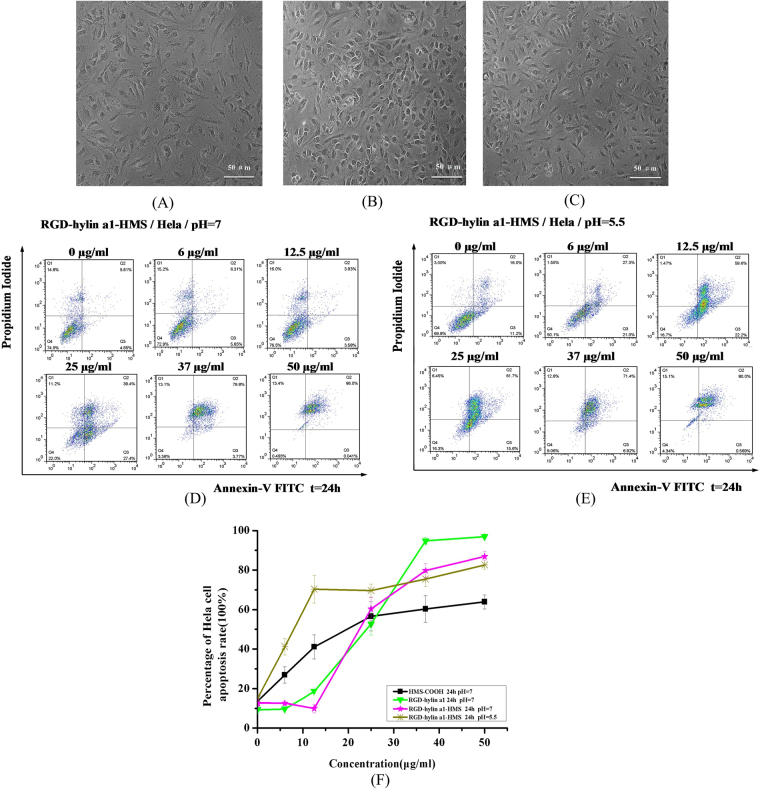
Figure 5.
Cytotoxicity assays of HMS-COOH and RGD-hylin a1-HMS (pH = 7 and pH = 5.5) in Hela cells. Cellular morphology was observed by 10× inverted microscope. (A) Hela cells were treated with 25 μg/ml HMS-COOH for 24 h; (B) Hela cells were treated with 25 μg/ml RGD-hylin a1-HMS (pH = 7) for 24 h; (C) Hela cells were treated with 25 μg/ml RGD-hylin a1-HMS (pH = 5.5) for 24 h; (D) RGD-hylin a1-HMS induced apoptosis of Hela cells. Hela cells were treated with various concentrations of RGD-hylin a1-HMS (pH = 7) for 24 h. (E) RGD-hylin a1-HMS induced apoptosis of Hela cells. Hela cells were treated with various concentrations of RGD-hylin a1-HMS (pH = 5.5) for 24 h. (F) Quantification of apoptosis rates of HMS-COOH, RGD-hylin a1, and RGD-hylin a1-HMS (pH = 7 and pH = 5.5) in Hela cells.

