Figure 1.
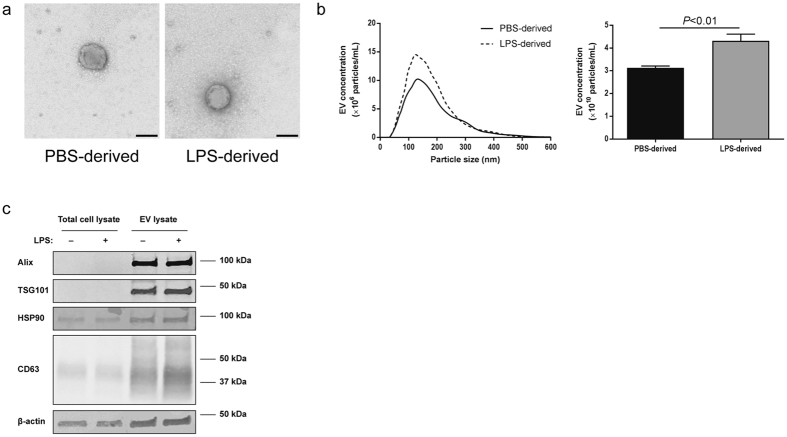
Isolation and identification of EVs secreted from H69 cells. (a) The morphology of PBS- and LPS-derived EVs analyzed by transmission electron microscope. Scale bar: 100 nm. (b) Nanoparticle tracking analysis for isolated H69-derived EVs. EV concentrations were calculated depending on the particle size. An example for PBS- (solid line) and LPS-derived (dashed line) EVs is shown (left). Total EV concentrations for PBS- and LPS-derived EVs (n = 6, right). (c) Immunoblotting for EV markers. Total H69 cell lysates and H69-derived EV lysates were analyzed by SDS-PAGE. The position of molecular weight markers for each protein is shown.

