Figure 5.
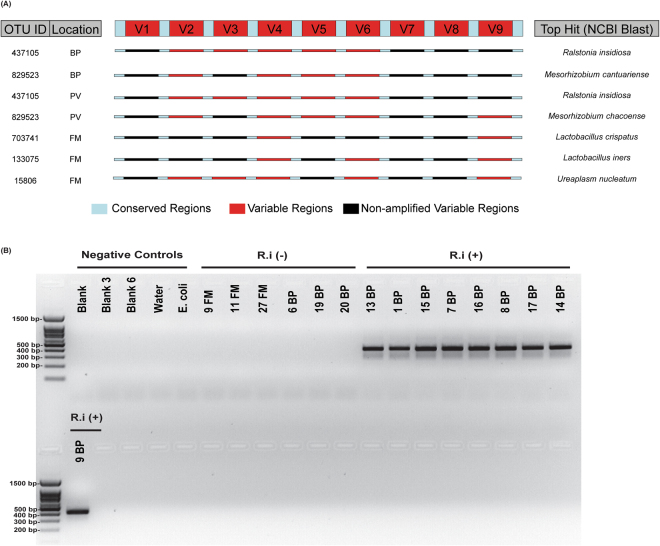
Species-specific analyses using multiple variable regions and species-specific primers. (A) (Left Panel) Summary of the most prevalent OTU IDs and the selected representative samples (chosen based on having the highest number of detectable variable regions and were not present in the V4 negative controls for each location/OTU ID. (Top Center) Schematic of the 16S rRNA gene, with conserved regions (light blue) and variable regions (red). (Center) Schematic of the 16S rRNA gene for each representative sample, where red indicates amplified variable regions and black indicates regions that were not amplified for that sample. (Right panel) Top BLAST hits for each OTU ID, based on the “semi-composite” sequence generated from amplified variable regions of representative samples. (B) Amplification of qPCR product for R.i (403 bp) in BP samples, which were positive by 16S rRNA sequencing. The full-length gel shows molecular sizes of markers of the 100 base pair ladder and negative controls, including blanks, water, E. coli plus BP and FM samples that were not positive for R.i according to sequencing analyses. Samples were from the same qPCR analysis and run on the gel together.

