Fig. 2.
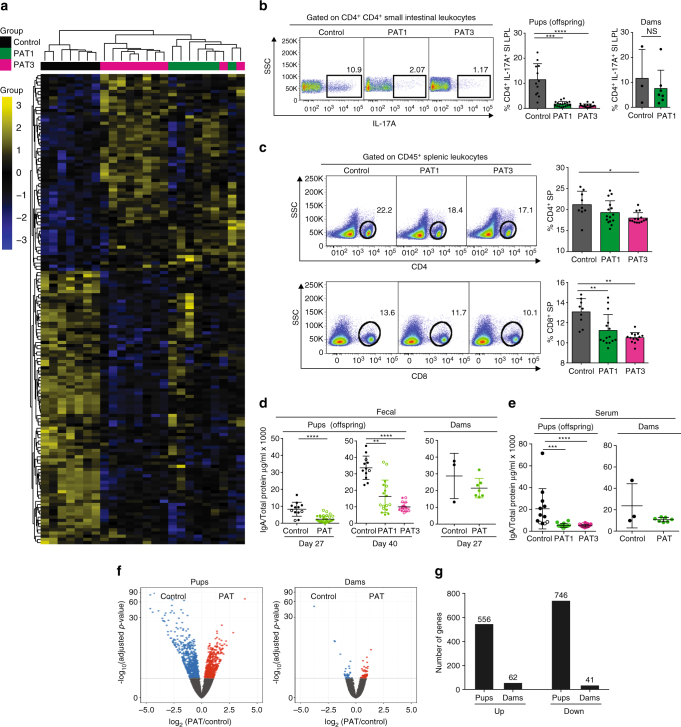
Administration of one or three macrolide courses alters ileal gene signatures and T-cell populations. a Heatmap with unsupervised clustering of FDR-corrected, differential ileal gene expression profiles using Nanostring technology (Control (n = 7), PAT1 (n = 8) and PAT3 (n = 9)). After one-way ANOVA, Tukey HSD multiple comparison testing and FDR-correction, 148 genes remained significantly different between the groups. b Mean (±SD) frequency of small intestine lamina propria lymphocytes after PAT1, PAT3 or control exposure. Cells were isolated at sacrifice from pups (mean P52) and their respective dams (P61). Populations were gated on live CD45+CD4+ cells, and representative frequencies of CD4+IL17A+ cells shown. c Frequency of splenic lymphocytes after PAT1, PAT3 or control exposure. Cells were isolated from pups at sacrifice, gated on CD4+ and CD8+ populations, and representative frequencies shown. Data compiled from three experiments (n = 9–19 mice/group). d Secretory IgA (μg/ml) (mean ± SD) in fecal samples of control and PAT-exposed dams at P27 and their pups at P27 and P40. e Serum IgA (μg/ml) (mean ± SD) in control and PAT-exposed mice in pup and dam samples at mean P52 or P61, respectively. For panels (b–e) significance testing performed using the Mann–Whitney non-parametric test or the Kruskal–Wallis non-parametric test used with Dunnett’s multiple comparisons test. f Volcano plots showing significant global ileal transcriptomic alterations in pups and dams, determined by RNAseq; n > 16,000 genes examined, control (n = 3) and PAT (n = 6) dams, respectively; control (n = 3) or PAT (n = 4) pups. g Differentially expressed genes in relation to PAT exposure in P52 pups, and their dams at P61, determined by RNAseq, and depicted by direction of differences. For all panels: *p < 0.05, **p < 0.01, ***p < 0.001, ****p < 0.0001

