
Fig. 5.
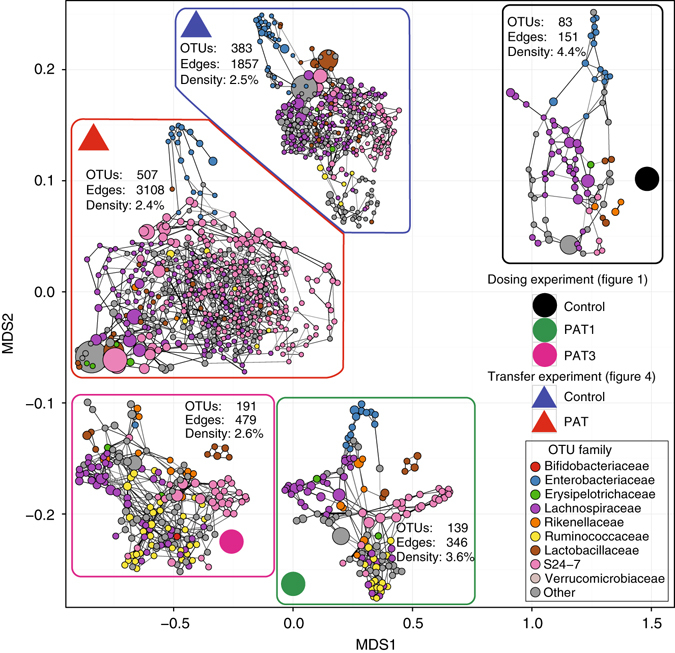
Network properties recapitulate experimental perturbation. Networks were inferred using the SPIEC-EASI pipeline. To compare graphs, a two-dimensional embedding of graphlet correlation distances (using multidimensional scaling (MDS)) was used with the network positions shown as circles (from the dosing experiment (see Fig. 1)) or triangles (from the transfer experiment (see Fig. 4)). The corresponding networks on the MDS plot were overlaid near their respective positions in the embedding, and shown in a force-directed layout. Within each graph, nodes are colored by OTU family, with size proportional to (geometric) mean abundance, and edge width proportional to confidence score, as determined by stability selection. Each panel shows the number of OTUs (identified as those present in > 20% of samples), corresponding number of edges and calculated edge density (predicted edges/number of pairs of nodes)