Fig. 2.
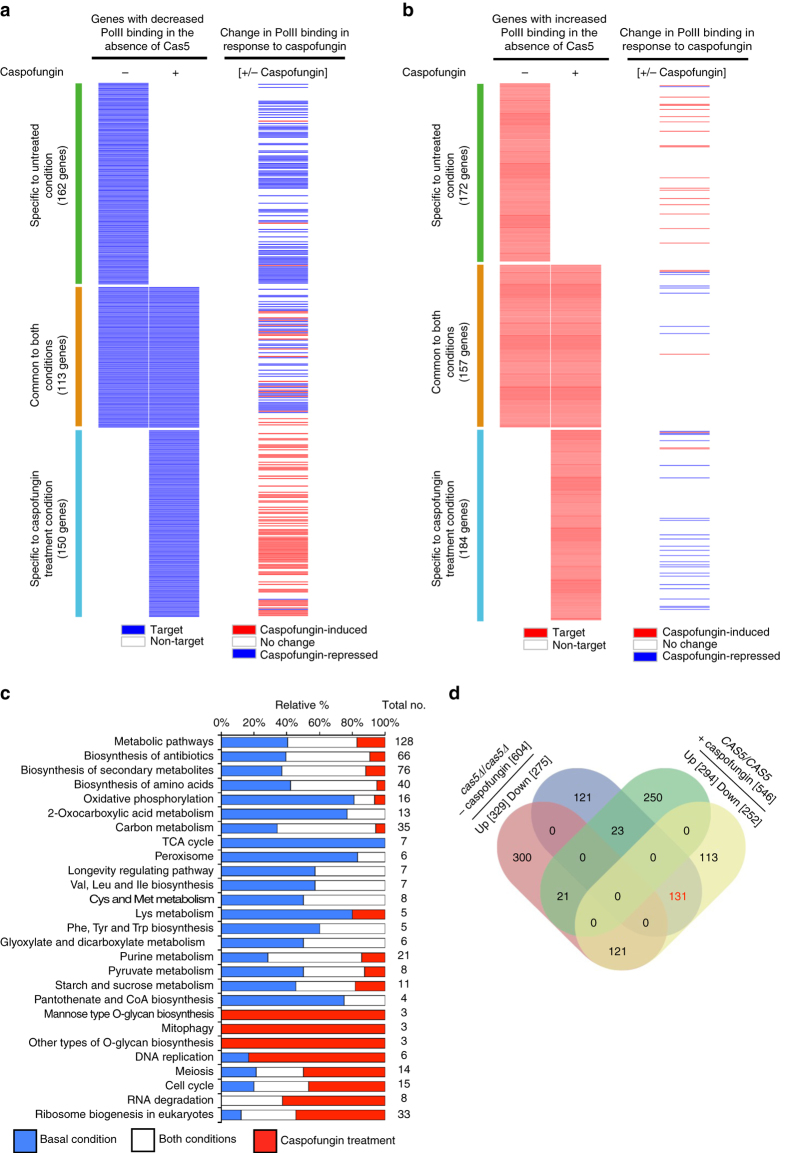
Cas5 regulatory network is rewired in response to caspofungin treatment. a, b Heat maps comparing Cas5-dependent genes with caspofungin-regulated genes. a The left heat map shows the overlap of genes with Cas5-dependent increased RNA PolII binding with (+) and without (−) caspofungin treatment. Cas5-dependent genes are indicated by a solid blue line. The right heat map indicates those genes with increased binding (red) and decreased binding (blue) in a wild-type strain upon caspofungin treatment. b The left heat map shows the overlap of genes with Cas5-dependent reduced RNA PolII binding with (+) and without (−) caspofungin treatment. Cas5-dependent genes are indicated by a solid red line. The right heat map indicates those genes with increased (red) or decreased (blue) RNA PolII binding in a wild-type strain upon caspofungin treatment. c Bar graph showing the relative percentage of Cas5-dependent genes specific to basal conditions (blue bars), specific to caspofungin treatment (red bars), or common to both conditions (white bars) in the indicated KEGG pathways. The total number of genes belonging to each KEGG pathway are indicated. Only selected KEGG pathways are shown based on number of genes enriched for PolII binding either under basal or caspofungin conditions. See Supplementary Data 4 for complete data set. d Venn diagram depicting number of genes differentially bound in a cas5∆/cas5∆ mutant relative to wildtype under basal conditions (increased, red; decreased, blue) and genes responding to caspofungin treatment in a wild-type strain (increased, green; decreased, yellow). The 131 genes highlighted in red text represent the substantial fraction of the genes with Cas5-dependent increase in RNA PolII binding under basal conditions that have reduced PolII binding in response to caspofungin

